
Bitcoin price prediction: Further downside risk looms as BTC gains 2.64%

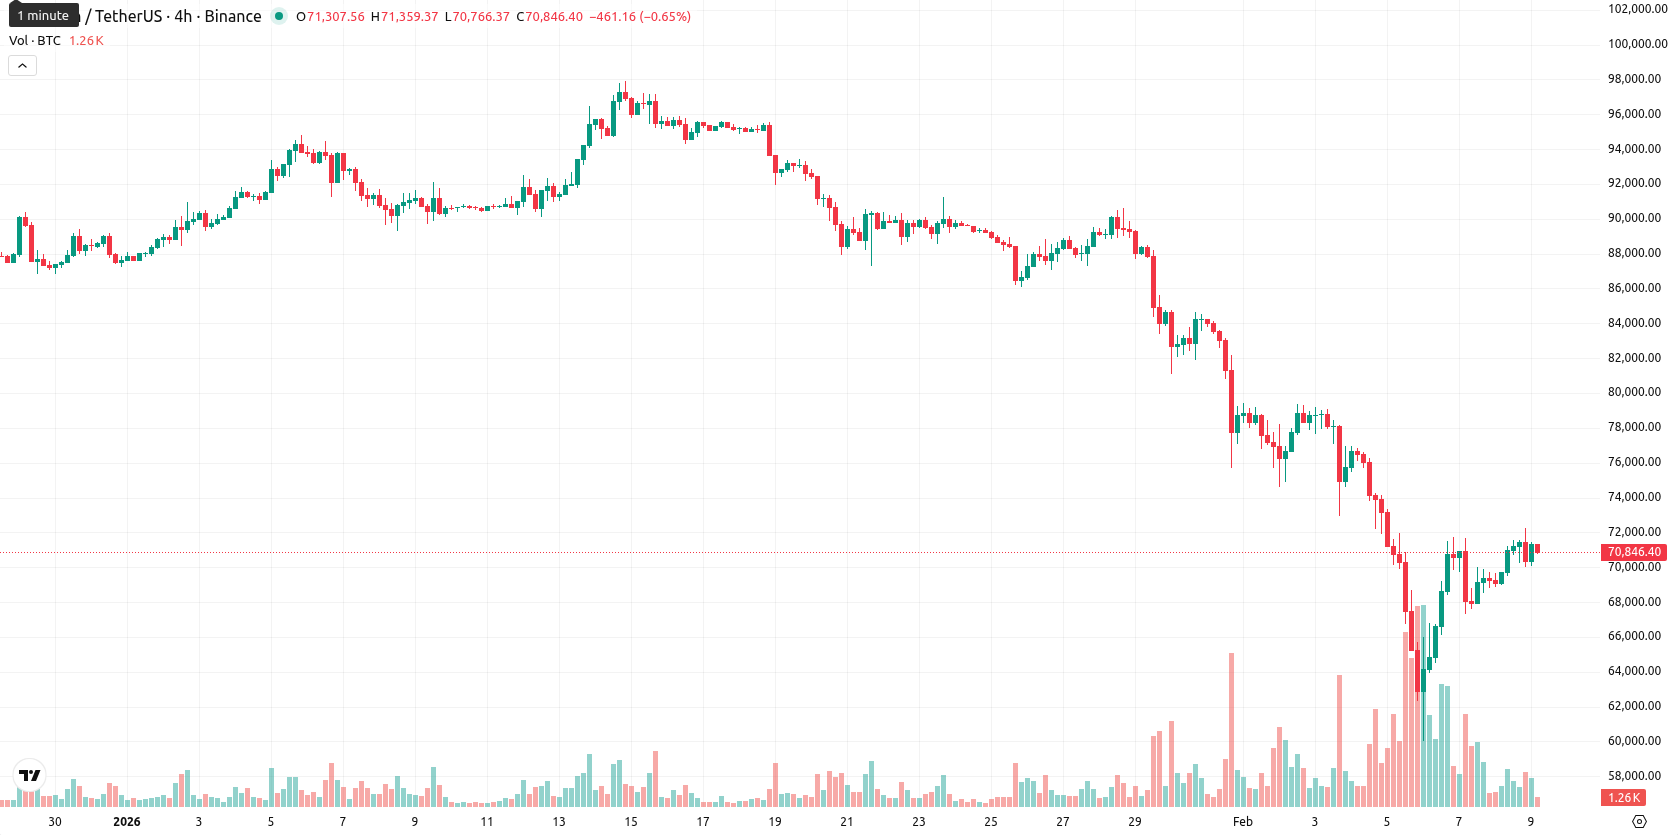
Bitcoin (BTC) is trading at $71,049.06, well below the MA-20 ($81,267.00), MA-50 ($87,021.27), and MA-200 ($102,311.03), highlighting persistent seller pressure in both short- and long-term trends.
Highlights
- Bitcoin is trading at $71,049.06, significantly below its MA-20 ($81,267.00), MA-50 ($87,021.27), and MA-200 ($102,311.03), confirming dominant seller pressure.
- Momentum indicators including MACD, ADX, and oscillators indicate persistent bearish strength, with the market approaching but not entering oversold conditions.
- Key technical boundaries are $70,000–$74,000, with the Ichimoku Kijun resistance at $78,962.25 and a bearish scenario likely if price breaks below $70,000.
Bearish momentum prevails as resistance overtakes support at current range
The nearest dynamic resistance is set by the Ichimoku Kijun at $78,962.25, with little visible support from major moving averages at current levels. Momentum remains negative, as both MACD and ADX signal ongoing bearish strength. RSI, Commodity Channel Index, and Stochastic RSI are close to oversold territory but do not yet indicate a reversal, while Bull/Bear Power confirms seller dominance. Bitcoin opened higher relative to the previous close, trading near today's upper range, and oscillators suggest a divergence with daily gains not supported by a confirmed trend change.
Limited upside as range-bound trading and downside risk dominate outlook
Over the next five sessions, BTC is likely to fluctuate within a typical volatility band of $70,000 to $74,000. The probability of further gains is low (less than 20%), so downside moves are more likely in the short term. Unless momentum improves and BTC breaks above the Ichimoku Kijun and the $74,000 resistance, continued sideways action between $70,000 and $74,000 is expected. A drop below $70,000 would expose BTC to additional downside risk if selling pressure accelerates.
Previously it was reported that Block Inc. shares rose 5% amid announcement of significant layoffs targeting up to 10% of the workforce as part of a restructuring, following profit growth driven by Cash App but slowing bitcoin revenue. The stock remains in focus ahead of quarterly earnings, with analysts watching for improved efficiency from the reorganization and integration efforts, while support may be forming around ongoing product expansions and recent S&P 500 inclusion.


Latest Bitcoin News


-
 Afghanistan
-
 Albania
-
 Algeria
-
 Angola
-
 Argentina
-
 Armenia
-
 Australia
-
 Austria
-
 Azerbaijan
-
 Bahamas
-
 Bahrain
-
 Bangladesh
-
 Belarus
-
 Belgium
-
 Bolivia
-
 Botswana
-
 Brazil
-
 Brunei
-
 Bulgaria
-
 Cambodia
-
 Cameroon
-
 Canada
-
 Chile
Chile
-
 China
China
-
 Colombia
-
 Congo
Congo
-
 Costa Rica
-
 Cote d'Ivoire
-
 Croatia
-
 Cuba
Cuba
-
 Cyprus
-
 Czechia
-
 DR Congo
-
 Denmark
-
 Dominican Republic
-
 Ecuador
-
 Egypt
Egypt
-
 El Salvador
-
 Estonia
-
 Eswatini
-
 Ethiopia
-
 Finland
-
 France
-
 Georgia
-
 Germany
-
 Ghana
Ghana
-
 Greece
-
 Haiti
Haiti
-
 Hong Kong
-
 Hungary
-
 India
India
-
 Indonesia
-
 Iran, Islamic republic
-
 Iraq
Iraq
-
 Ireland
-
 Israel
-
 Italy
Italy
-
 Jamaica
-
 Japan
Japan
-
 Jordan
-
 Kazakhstan
-
 Kenya
Kenya
-
 Korea
Korea
-
 Kuwait
-
 Kyrgyzstan
-
 Laos
Laos
-
 Latvia
-
 Lebanon
-
 Lesotho
-
 Libya
Libya
-
 Lithuania
-
 Luxembourg
-
 Madagascar
-
 Malaysia
-
 Malta
Malta
-
 Mauritius
-
 Mexico
-
 Moldova
-
 Mongolia
-
 Montenegro
-
 Morocco
-
 Mozambique
-
 Myanmar
-
 Namibia
-
 Nepal
Nepal
-
 Netherlands
-
 New Zealand
-
 Nigeria
-
 North Macedonia
-
 Norway
-
 Oman
Oman
-
 Pakistan
-
 Palestine
-
 Panama
-
 Papua New Guinea
-
 Paraguay
-
 Peru
Peru
-
 Philippines
-
 Poland
-
 Portugal
-
 Puerto Rico
-
 Qatar
Qatar
-
 Reunion
-
 Romania
-
 Rwanda
-
 Saudi Arabia
-
 Serbia
-
 Singapore
-
 Slovakia
-
 Slovenia
-
 Somalia
-
 South Africa
-
 Spain
Spain
-
 Sri Lanka
-
 Sweden
-
 Switzerland
-
 Syria
Syria
-
 Taiwan
-
 Tajikistan
-
 Tanzania
-
 Thailand
-
 Trinidad and Tobago
-
 Tunisia
-
 Turkey
-
 UAE
UAE
-
 Uganda
-
 Ukraine
-
 United Kingdom
-
United States
-
 Uruguay
-
 Uzbekistan
-
 Venezuela
-
 Vietnam
-
 Yemen
Yemen
-
 Zambia
-
 Zimbabwe
- Forex
- Crypto
