
Bitcoin Cash shows limited upside potential with weak indicators and dynamic resistance at $526.80 – weekly analysis

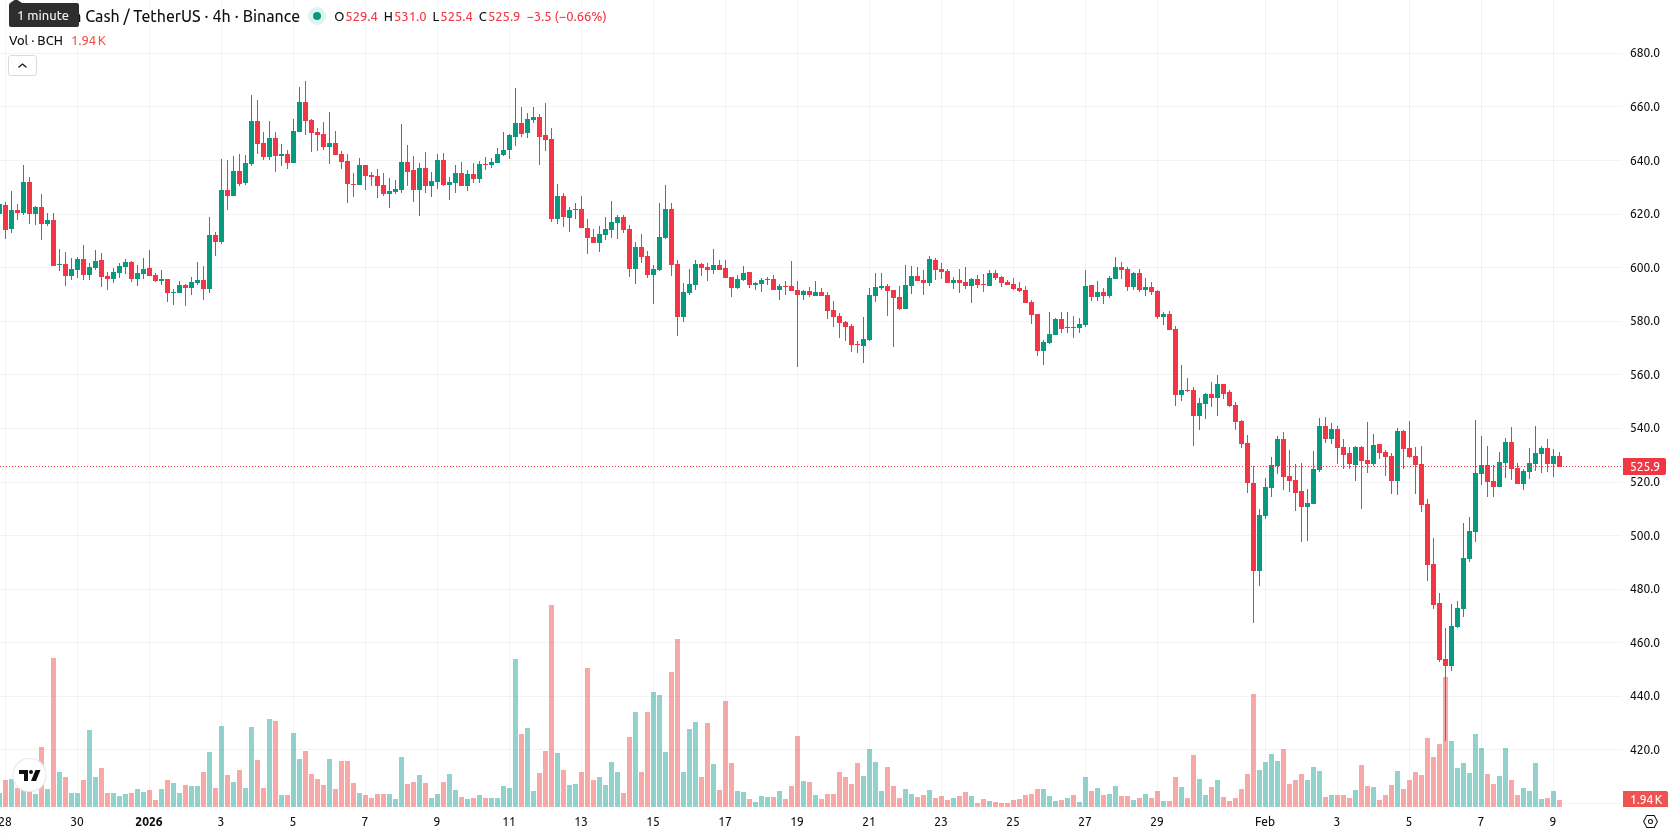
Bitcoin Cash (BCH) is currently trading at $527, recording a decrease for the week both in absolute and percentage terms. The asset remains under consistent selling pressure, as it is positioned below its weekly MA-20 at $552.36, MA-50 at $587.19, and MA-200 at $562.14, highlighting weakness across short-, medium-, and long-term trends.
Highlights
- Bitcoin Cash trades at $527, below MA-20 ($552.36), MA-50 ($587.19), and MA-200 ($562.14), reflecting sustained multi-period selling pressure.
- Daily MACD and ADX indicate weak negative momentum, while RSI and CCI suggest mild selling and Stochastic RSI trends near neutral yet slightly overbought.
- Expected five-day range is $510–$540; consolidation is likely, with breakout above $540 needed for bullish reversal and drop below $510 risking further downside.
Bearish momentum signals reinforced as key support holds for now
On the weekly chart, BCH is trading below all major weekly moving averages (MA-20, MA-50, and MA-200), confirming a bearish trend and persistent resistance. The nearest dynamic resistance is set by the Ichimoku Kijun at $526.80, with no golden or death cross observed on the weekly timeframe. Key weekly support is at $510, with resistance at $540. Weekly RSI and CCI suggest a mild selling bias; the Stochastic RSI is near neutral with a slight overbought hint, while MACD and ADX point to weak negative momentum.
Limited upside seen as rangebound consolidation expected next week
Over the next five to seven trading days, BCH is expected to consolidate within a $510 to $540 range. Based on weekly indicators, there is a less than 20% probability of a price increase, indicating downside risk is favored. A bullish scenario would require a strong breakout above $540 resistance, while a close below $510 would open the door to deeper declines. The baseline scenario calls for further sideways action within this established corridor.
Previously it was reported that Bitcoin Cash is trading below its key moving averages, facing strong downside pressure amid persistent volatility and mixed momentum signals, with daily MACD and ADX reflecting a bearish bias, Stochastic RSI suggesting a buy, and RSI remaining neutral to weak. Immediate resistance is identified near $543, dynamic support around $498, and the asset is expected to drift sideways with bearish odds outweighing recovery prospects in the near term.


Latest Bitcoin Cash News


-
 Afghanistan
-
 Albania
-
 Algeria
-
 Angola
-
 Argentina
-
 Armenia
-
 Australia
-
 Austria
-
 Azerbaijan
-
 Bahamas
-
 Bahrain
-
 Bangladesh
-
 Belarus
-
 Belgium
-
 Bolivia
-
 Botswana
-
 Brazil
-
 Brunei
-
 Bulgaria
-
 Cambodia
-
 Cameroon
-
 Canada
-
 Chile
Chile
-
 China
China
-
 Colombia
-
 Congo
Congo
-
 Costa Rica
-
 Cote d'Ivoire
-
 Croatia
-
 Cuba
Cuba
-
 Cyprus
-
 Czechia
-
 DR Congo
-
 Denmark
-
 Dominican Republic
-
 Ecuador
-
 Egypt
Egypt
-
 El Salvador
-
 Estonia
-
 Eswatini
-
 Ethiopia
-
 Finland
-
 France
-
 Georgia
-
 Germany
-
 Ghana
Ghana
-
 Greece
-
 Haiti
Haiti
-
 Hong Kong
-
 Hungary
-
 India
India
-
 Indonesia
-
 Iran, Islamic republic
-
 Iraq
Iraq
-
 Ireland
-
 Israel
-
 Italy
Italy
-
 Jamaica
-
 Japan
Japan
-
 Jordan
-
 Kazakhstan
-
 Kenya
Kenya
-
 Korea
Korea
-
 Kuwait
-
 Kyrgyzstan
-
 Laos
Laos
-
 Latvia
-
 Lebanon
-
 Lesotho
-
 Libya
Libya
-
 Lithuania
-
 Luxembourg
-
 Madagascar
-
 Malaysia
-
 Malta
Malta
-
 Mauritius
-
 Mexico
-
 Moldova
-
 Mongolia
-
 Montenegro
-
 Morocco
-
 Mozambique
-
 Myanmar
-
 Namibia
-
 Nepal
Nepal
-
 Netherlands
-
 New Zealand
-
 Nigeria
-
 North Macedonia
-
 Norway
-
 Oman
Oman
-
 Pakistan
-
 Palestine
-
 Panama
-
 Papua New Guinea
-
 Paraguay
-
 Peru
Peru
-
 Philippines
-
 Poland
-
 Portugal
-
 Puerto Rico
-
 Qatar
Qatar
-
 Reunion
-
 Romania
-
 Rwanda
-
 Saudi Arabia
-
 Serbia
-
 Singapore
-
 Slovakia
-
 Slovenia
-
 Somalia
-
 South Africa
-
 Spain
Spain
-
 Sri Lanka
-
 Sweden
-
 Switzerland
-
 Syria
Syria
-
 Taiwan
-
 Tajikistan
-
 Tanzania
-
 Thailand
-
 Trinidad and Tobago
-
 Tunisia
-
 Turkey
-
 UAE
UAE
-
 Uganda
-
 Ukraine
-
 United Kingdom
-
United States
-
 Uruguay
-
 Uzbekistan
-
 Venezuela
-
 Vietnam
-
 Yemen
Yemen
-
 Zambia
-
 Zimbabwe
- Forex
- Crypto
