
Nexo holds near $0.81 as strong resistance from major moving averages limits upside – weekly outlook

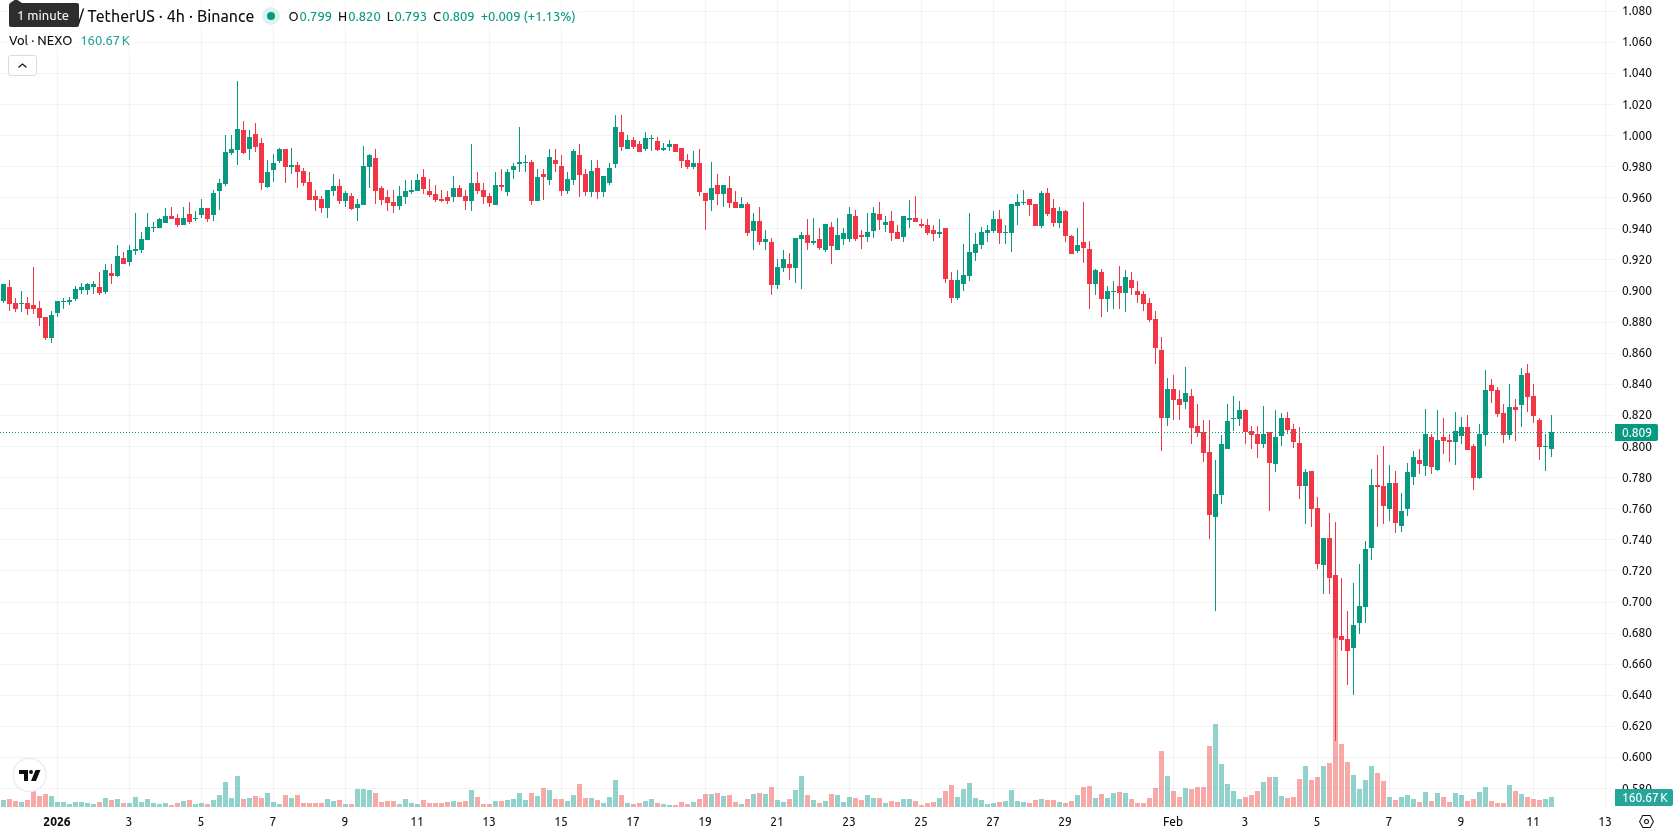
Nexo (NEXO) is trading at $0.81, down from last week and posting a weekly decline both in absolute and percentage terms. The current price remains below its weekly MA-20 at $0.8551, MA-50 at $0.9081, and MA-200 at $1.1020, indicating persistent selling pressure across all observed timeframes.
Highlights
- NEXO is trading at $0.81, below the MA-20 ($0.8551), MA-50 ($0.9081), and MA-200 ($1.1020), indicating persistent selling pressure across all timeframes.
- The MACD, ADX, and weekly RSI indicate strong downside momentum, with daily oscillators showing mixed signals and Stochastic RSI in overbought territory.
- Key intraday resistance sits near $0.8115 (Ichimoku Kijun), with the next resistance at $0.8551 (MA-20); support is at $0.78, with 5-day range likely $0.78–$0.84.
Sustained downside confirmed by resistance clusters and momentum indicators
On the weekly chart, NEXO continues to face strong resistance from all major moving averages, with the MA-20 at $0.8551 and the MA-50 at $0.9081 acting as key resistance levels. The Ichimoku Kijun near $0.8115 provides additional overhead resistance, while weekly support is found near $0.78. Weekly RSI and Commodity Channel Index suggest the asset is neither overbought nor oversold, but the MACD and ADX both confirm ongoing downside momentum.
Range-bound outlook as bearish momentum tempers upside prospects
Over the next 5–7 trading days, NEXO is expected to stay range-bound between $0.78 and $0.84, reflecting moderate volatility and persistent bearish momentum on the weekly indicators. The probability of a breakout to the upside remains low without a decisive move above $0.84 and supportive momentum, while a close below $0.78 would likely open the way for further declines toward recent lows. The baseline scenario is for sideways movement within this corridor, with downside risks dominating the outlook.
Last time, analysts noted that Nexo is trading below key moving averages and faces mixed momentum signals, with the MACD and ADX indicating ongoing bearish pressure despite an intraday gain. The asset is expected to consolidate between support around $0.8115 and resistance near $0.860, with a downside bias and a low probability of a significant short-term breakout.


Latest Nexo News


-
 Afghanistan
-
 Albania
-
 Algeria
-
 Angola
-
 Argentina
-
 Armenia
-
 Australia
-
 Austria
-
 Azerbaijan
-
 Bahamas
-
 Bahrain
-
 Bangladesh
-
 Belarus
-
 Belgium
-
 Bolivia
-
 Botswana
-
 Brazil
-
 Brunei
-
 Bulgaria
-
 Cambodia
-
 Cameroon
-
 Canada
-
 Chile
Chile
-
 China
China
-
 Colombia
-
 Congo
Congo
-
 Costa Rica
-
 Cote d'Ivoire
-
 Croatia
-
 Cuba
Cuba
-
 Cyprus
-
 Czechia
-
 DR Congo
-
 Denmark
-
 Dominican Republic
-
 Ecuador
-
 Egypt
Egypt
-
 El Salvador
-
 Estonia
-
 Eswatini
-
 Ethiopia
-
 Finland
-
 France
-
 Georgia
-
 Germany
-
 Ghana
Ghana
-
 Greece
-
 Haiti
Haiti
-
 Hong Kong
-
 Hungary
-
 India
India
-
 Indonesia
-
 Iran, Islamic republic
-
 Iraq
Iraq
-
 Ireland
-
 Israel
-
 Italy
Italy
-
 Jamaica
-
 Japan
Japan
-
 Jordan
-
 Kazakhstan
-
 Kenya
Kenya
-
 Korea
Korea
-
 Kuwait
-
 Kyrgyzstan
-
 Laos
Laos
-
 Latvia
-
 Lebanon
-
 Lesotho
-
 Libya
Libya
-
 Lithuania
-
 Luxembourg
-
 Madagascar
-
 Malaysia
-
 Malta
Malta
-
 Mauritius
-
 Mexico
-
 Moldova
-
 Mongolia
-
 Montenegro
-
 Morocco
-
 Mozambique
-
 Myanmar
-
 Namibia
-
 Nepal
Nepal
-
 Netherlands
-
 New Zealand
-
 Nigeria
-
 North Macedonia
-
 Norway
-
 Oman
Oman
-
 Pakistan
-
 Palestine
-
 Panama
-
 Papua New Guinea
-
 Paraguay
-
 Peru
Peru
-
 Philippines
-
 Poland
-
 Portugal
-
 Puerto Rico
-
 Qatar
Qatar
-
 Reunion
-
 Romania
-
 Rwanda
-
 Saudi Arabia
-
 Serbia
-
 Singapore
-
 Slovakia
-
 Slovenia
-
 Somalia
-
 South Africa
-
 Spain
Spain
-
 Sri Lanka
-
 Sweden
-
 Switzerland
-
 Syria
Syria
-
 Taiwan
-
 Tajikistan
-
 Tanzania
-
 Thailand
-
 Trinidad and Tobago
-
 Tunisia
-
 Turkey
-
 UAE
UAE
-
 Uganda
-
 Ukraine
-
 United Kingdom
-
United States
-
 Uruguay
-
 Uzbekistan
-
 Venezuela
-
 Vietnam
-
 Yemen
Yemen
-
 Zambia
-
 Zimbabwe
- Forex
- Crypto
