
Kaia climbs 7.14% as sellers dominate below key moving averages

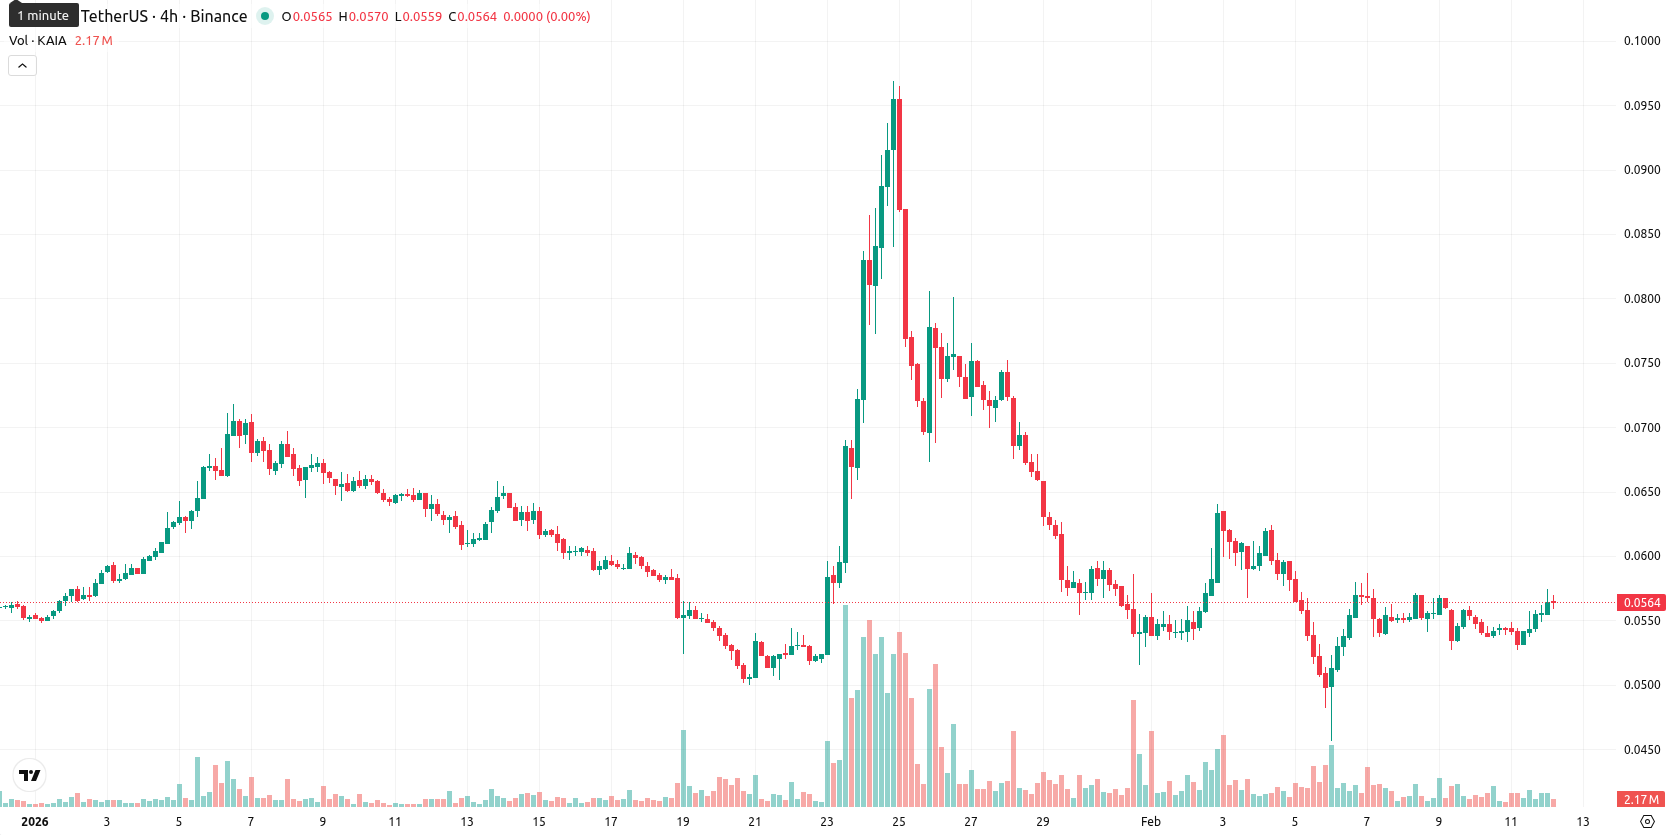
Kaia (KAIA) is trading at $0.0565, up 7.14% on the day. The token remains under pressure, sitting well below the MA-20 ($0.0623), MA-50 ($0.0607), and MA-200 ($0.1053) moving averages across all timeframes.
Highlights
- KAIA trades at $0.0565, below MA-20, MA-50, and MA-200, indicating persistent selling pressure across all timeframes.
- Indicators such as negative MACD, weak ADX, daily RSI at 45.85, and CCI at –61.12 reflect ongoing mild downside momentum.
- Short-term support is at $0.0552–$0.0564 with resistance at $0.0713; baseline scenario expects consolidation between $0.051 and $0.062 with downside risk prevailing.
Resistance caps gains as mixed momentum signals persist
On the technical side, immediate resistance is defined by the Ichimoku Kijun on the daily chart at $0.0713. Short-term support is provided by MA-5 and MA-10 at $0.0552–$0.0564. Momentum signals are mixed, as the daily MACD shows a negative "Sell" signal and the ADX points to weak trend strength. The RSI at 45.85 and CCI at –61.12 highlight mild downside pressure without oversold extremes, while slightly negative Bull/Bear Power confirms seller dominance intraday.
Downside risk dominates as volatility and bearish signals converge
Looking ahead, the typical volatility band for KAIA is expected between $0.051 and $0.062 in the short term (approximately ±10% from current levels), with consolidation likely. Most technical signals suggest a higher probability of a move lower, as weekly MACD, RSI, ADX, and MA-50 all align bearish. However, a sustained break above the $0.0713 Kijun baseline could open further upside potential, while a decline below $0.051 might accelerate downside momentum.
Last time, analysts noted that Kaia (KAIA) is trading below all major moving averages, facing bearish momentum and strong resistance at the Ichimoku Kijun, with local support just beneath current levels. Despite oversold readings on multiple momentum indicators, intraday price action has shown a sharp rebound and elevated volatility, resulting in mixed technical signals.


-
 Afghanistan
-
 Albania
-
 Algeria
-
 Angola
-
 Argentina
-
 Armenia
-
 Australia
-
 Austria
-
 Azerbaijan
-
 Bahamas
-
 Bahrain
-
 Bangladesh
-
 Belarus
-
 Belgium
-
 Bolivia
-
 Botswana
-
 Brazil
-
 Brunei
-
 Bulgaria
-
 Cambodia
-
 Cameroon
-
 Canada
-
 Chile
Chile
-
 China
China
-
 Colombia
-
 Congo
Congo
-
 Costa Rica
-
 Cote d'Ivoire
-
 Croatia
-
 Cuba
Cuba
-
 Cyprus
-
 Czechia
-
 DR Congo
-
 Denmark
-
 Dominican Republic
-
 Ecuador
-
 Egypt
Egypt
-
 El Salvador
-
 Estonia
-
 Eswatini
-
 Ethiopia
-
 Finland
-
 France
-
 Georgia
-
 Germany
-
 Ghana
Ghana
-
 Greece
-
 Haiti
Haiti
-
 Hong Kong
-
 Hungary
-
 India
India
-
 Indonesia
-
 Iran, Islamic republic
-
 Iraq
Iraq
-
 Ireland
-
 Israel
-
 Italy
Italy
-
 Jamaica
-
 Japan
Japan
-
 Jordan
-
 Kazakhstan
-
 Kenya
Kenya
-
 Korea
Korea
-
 Kuwait
-
 Kyrgyzstan
-
 Laos
Laos
-
 Latvia
-
 Lebanon
-
 Lesotho
-
 Libya
Libya
-
 Lithuania
-
 Luxembourg
-
 Madagascar
-
 Malaysia
-
 Malta
Malta
-
 Mauritius
-
 Mexico
-
 Moldova
-
 Mongolia
-
 Montenegro
-
 Morocco
-
 Mozambique
-
 Myanmar
-
 Namibia
-
 Nepal
Nepal
-
 Netherlands
-
 New Zealand
-
 Nigeria
-
 North Macedonia
-
 Norway
-
 Oman
Oman
-
 Pakistan
-
 Palestine
-
 Panama
-
 Papua New Guinea
-
 Paraguay
-
 Peru
Peru
-
 Philippines
-
 Poland
-
 Portugal
-
 Puerto Rico
-
 Qatar
Qatar
-
 Reunion
-
 Romania
-
 Rwanda
-
 Saudi Arabia
-
 Serbia
-
 Singapore
-
 Slovakia
-
 Slovenia
-
 Somalia
-
 South Africa
-
 Spain
Spain
-
 Sri Lanka
-
 Sweden
-
 Switzerland
-
 Syria
Syria
-
 Taiwan
-
 Tajikistan
-
 Tanzania
-
 Thailand
-
 Trinidad and Tobago
-
 Tunisia
-
 Turkey
-
 UAE
UAE
-
 Uganda
-
 Ukraine
-
 United Kingdom
-
United States
-
 Uruguay
-
 Uzbekistan
-
 Venezuela
-
 Vietnam
-
 Yemen
Yemen
-
 Zambia
-
 Zimbabwe
- Forex
- Crypto
