
Kaia price prediction: Can $0.0377 resistance limit KAIA rally?

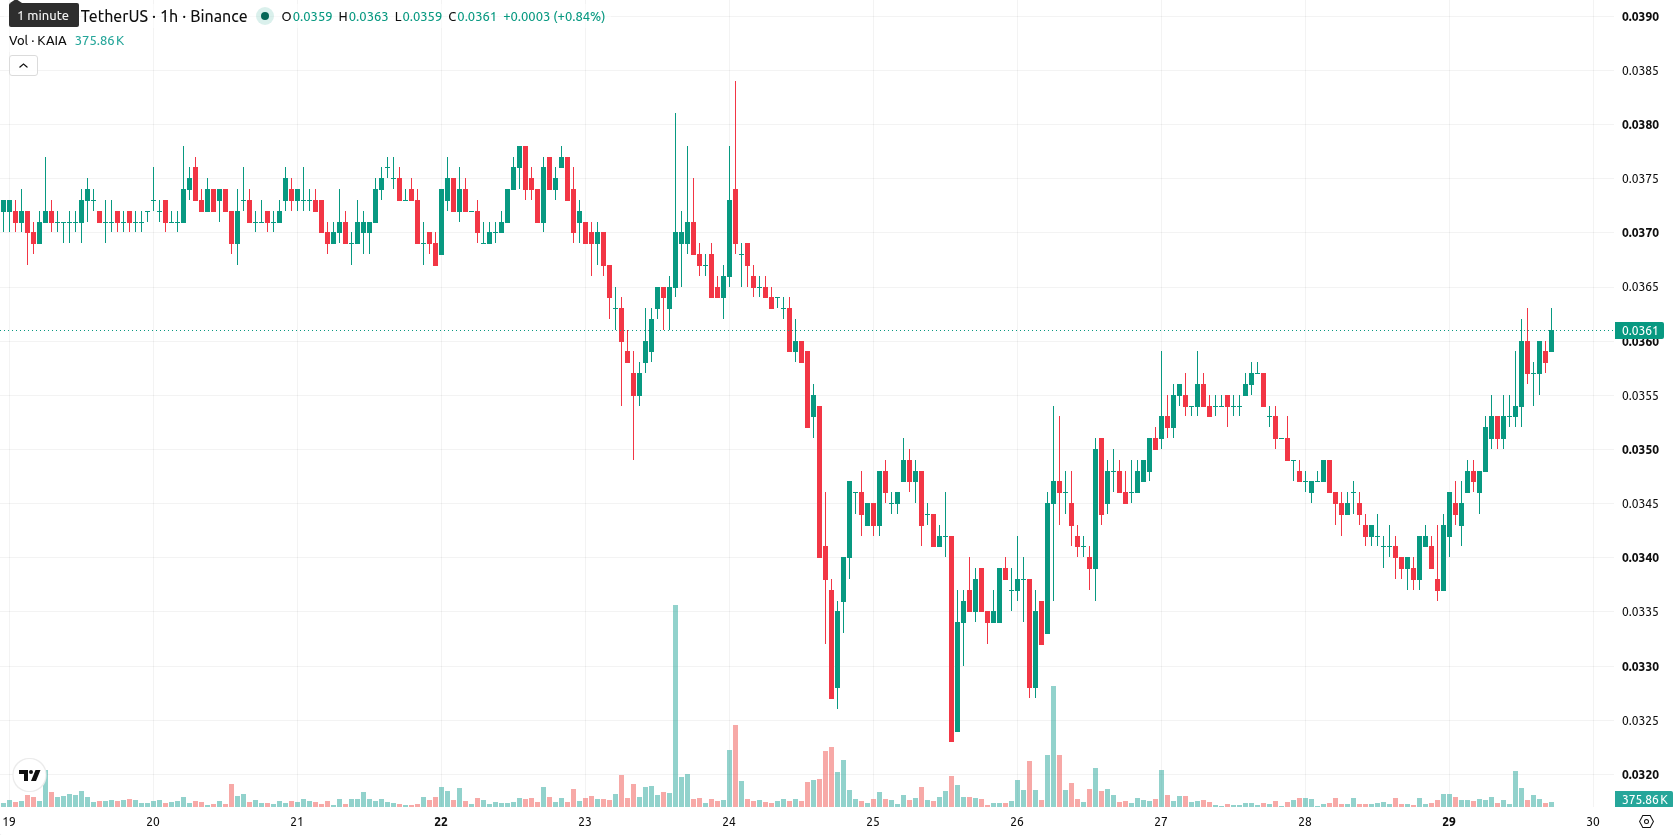
Kaia (KAIA) is trading at $0.0363 after a strong session, posting a 7.33% gain for the day. Price action stands above its key short- and medium-term moving averages and remains well supported intraday.
Highlights
- KAIA/USD shows strong intraday momentum with a 7.33% gain, but remains in a longer-term bearish trend.
- Buy signals dominate across most momentum indicators, though short-term overbought risks may prompt a brief pullback.
- Expected trading range for KAIA/USD is $0.034 to $0.0377 over the next 2–3 days, with high probability of upside consolidation.
Long-term resistance tested as indicator divergence emerges
On the hourly chart, KAIA traded above its 20- and 50-period moving averages, while the 200-period average on the daily chart remains much higher, delineating a key long-term resistance area. The Ichimoku Kijun is positioned at $0.0349, acting as immediate support for intraday price action. A review of the technical indicators shows that the Moving Average Convergence Divergence (MACD) and Average Directional Index (ADX) both confirm a buy setup, while the Relative Strength Index (RSI) and Commodity Channel Index (CCI) also deliver positive readings. However, Stochastic RSI signals a short-term sell, warning of local overbought conditions and producing divergence among oscillators. Bull/Bear Power highlights buyers in control intraday, with further confirmation from the Awesome Oscillator.
Consolidation likely within narrow band as upside breakout risk rises
Over the next 2–3 trading days, KAIA/USD is expected to consolidate within a volatility band between $0.034 and $0.0377. The baseline scenario points to sideways action within this defined range, with the probability of an upside breakout rated as very high and downside risk as very low. Should resistance be breached, further gains may be triggered, while a drop below the intraday support at $0.0349 would expose the pair to additional selling pressure.
Earlier, analysts noted that Kaia was experiencing sustained bearish momentum and persistent downside pressure. The current bounce above key short- and medium-term moving averages signals a potential shift in sentiment, making price action around the $0.0349 support pivotal for traders watching for either renewed upside or a reversal back into correction.


-
 Afghanistan
-
 Albania
-
 Algeria
-
 Angola
-
 Argentina
-
 Armenia
-
 Australia
-
 Austria
-
 Azerbaijan
-
 Bahamas
-
 Bahrain
-
 Bangladesh
-
 Belarus
-
 Belgium
-
 Bolivia
-
 Botswana
-
 Brazil
-
 Brunei
-
 Bulgaria
-
 Cambodia
-
 Cameroon
-
 Canada
-
 Chile
Chile
-
 China
China
-
 Colombia
-
 Congo
Congo
-
 Costa Rica
-
 Cote d'Ivoire
-
 Croatia
-
 Cuba
Cuba
-
 Cyprus
-
 Czechia
-
 DR Congo
-
 Denmark
-
 Dominican Republic
-
 Ecuador
-
 Egypt
Egypt
-
 El Salvador
-
 Estonia
-
 Eswatini
-
 Ethiopia
-
 Finland
-
 France
-
 Georgia
-
 Germany
-
 Ghana
Ghana
-
 Greece
-
 Haiti
Haiti
-
 Hong Kong
-
 Hungary
-
 India
India
-
 Indonesia
-
 Iran, Islamic republic
-
 Iraq
Iraq
-
 Ireland
-
 Israel
-
 Italy
Italy
-
 Jamaica
-
 Japan
Japan
-
 Jordan
-
 Kazakhstan
-
 Kenya
Kenya
-
 Korea
Korea
-
 Kuwait
-
 Kyrgyzstan
-
 Laos
Laos
-
 Latvia
-
 Lebanon
-
 Lesotho
-
 Libya
Libya
-
 Lithuania
-
 Luxembourg
-
 Madagascar
-
 Malaysia
-
 Malta
Malta
-
 Mauritius
-
 Mexico
-
 Moldova
-
 Mongolia
-
 Montenegro
-
 Morocco
-
 Mozambique
-
 Myanmar
-
 Namibia
-
 Nepal
Nepal
-
 Netherlands
-
 New Zealand
-
 Nigeria
-
 North Macedonia
-
 Norway
-
 Oman
Oman
-
 Pakistan
-
 Palestine
-
 Panama
-
 Papua New Guinea
-
 Paraguay
-
 Peru
Peru
-
 Philippines
-
 Poland
-
 Portugal
-
 Puerto Rico
-
 Qatar
Qatar
-
 Reunion
-
 Romania
-
 Rwanda
-
 Saudi Arabia
-
 Serbia
-
 Singapore
-
 Slovakia
-
 Slovenia
-
 Somalia
-
 South Africa
-
 Spain
Spain
-
 Sri Lanka
-
 Sweden
-
 Switzerland
-
 Syria
Syria
-
 Taiwan
-
 Tajikistan
-
 Tanzania
-
 Thailand
-
 Trinidad and Tobago
-
 Tunisia
-
 Turkey
-
 UAE
UAE
-
 Uganda
-
 Ukraine
-
 United Kingdom
-
United States
-
 Uruguay
-
 Uzbekistan
-
 Venezuela
-
 Vietnam
-
 Yemen
Yemen
-
 Zambia
-
 Zimbabwe
- Forex
- Crypto
