
Bitcoin Cash price prediction: Can BCH hold above $540 after 7% rally?

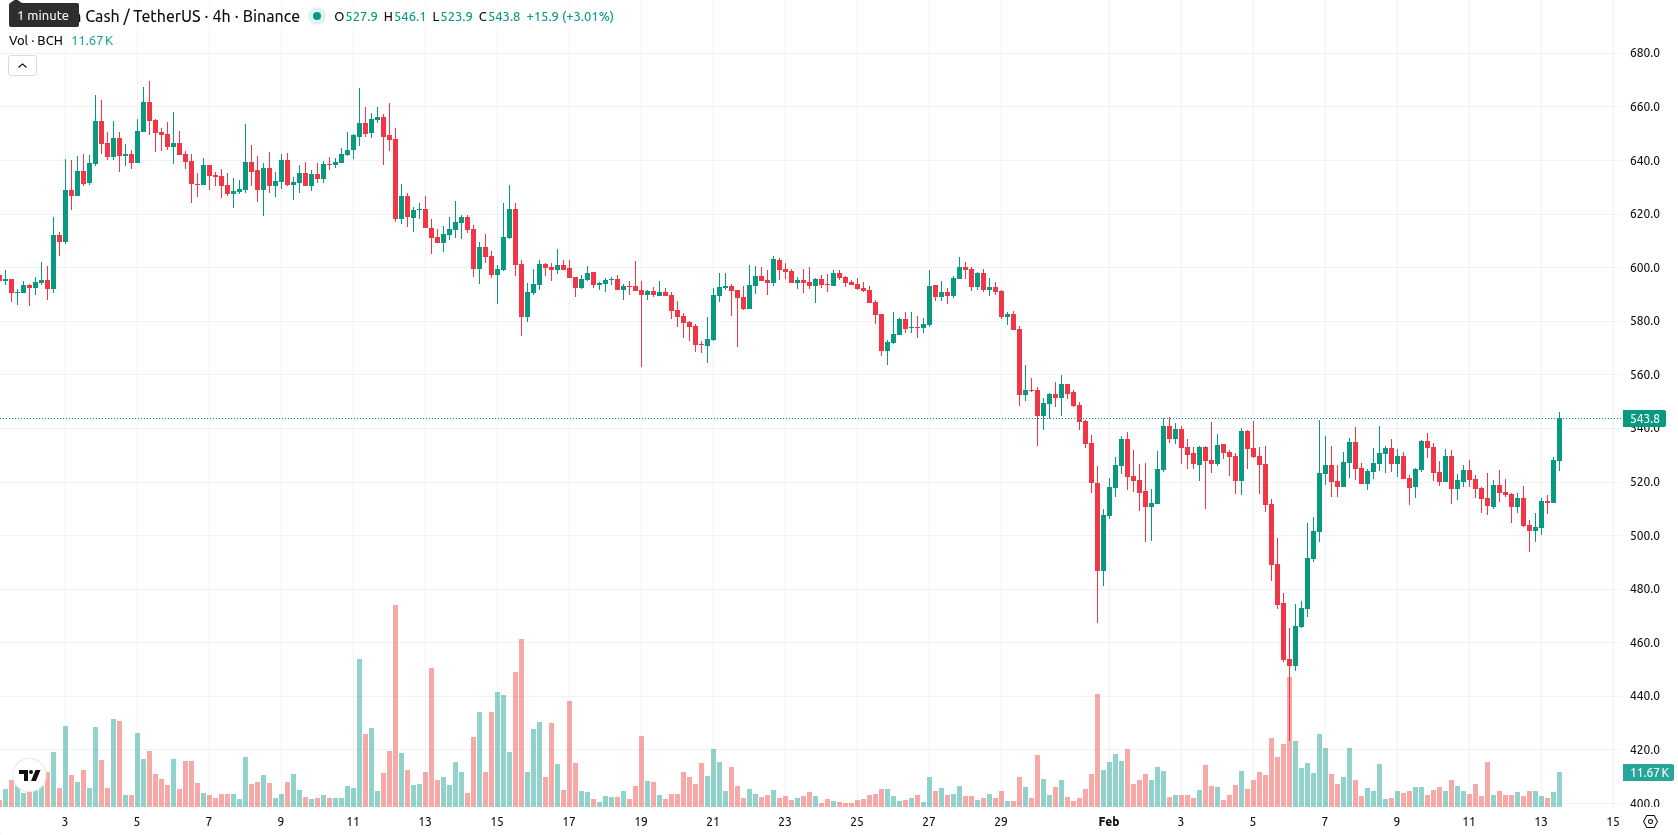
Bitcoin Cash (BCH) is trading at $541.80, positioned slightly above its MA-20 ($538.84) but remaining below both the MA-50 ($582.39) and MA-200 ($561.46). This setup highlights weak near-term support that has recently been regained, while medium- and long-term selling pressure continues to weigh on the asset.
Highlights
- BCH trades at $541.80, sitting slightly above the MA-20 ($538.84) but below both the MA-50 ($582.39) and MA-200 ($561.46), indicating ongoing selling pressure.
- Momentum signals are mixed; the D1 MACD suggests strong selling, ADX indicates trend strength with a selling bias, and oscillators point to lingering oversold conditions amid elevated volatility.
- Key technical levels are $585 (upper range resistance), $513.50 (Ichimoku Kijun dynamic support), and $495 (range floor), with less than 20% probability of a sustained breakout higher.
Mixed momentum and oversold signals amid heightened volatility
Technically, the Ichimoku Kijun at $513.50 marks the closest dynamic support, with the MA-50 at $582.39 acting as primary resistance. Momentum indicators are mixed — the daily MACD points to seller dominance, while the ADX confirms trend strength with a bearish tilt. Oscillators such as the RSI and Stochastic RSI suggest oversold conditions remain, even though the Stochastic RSI and CCI on shorter timeframes hint at overbought spikes. Bull/Bear Power remains in oversold territory, reflecting continued intraday seller control; overall volatility is elevated as the session trades near the daily high on the back of a pronounced 7.01% rally.
Consolidation forecast as breakout risk remains limited
In the near term, BCH is expected to trade within a volatility band between $495 and $585 for the next five sessions. The probability of a sustained breakout above this range is below 20%, and a break below dynamic support at $513 could open new downside. The base scenario is for consolidation in a broad range amid mixed momentum signals, while a decisive move above the $582 resistance would be needed to shift to a more bullish stance.
Previously it was reported that Bitcoin Cash is trading below its key moving averages and consolidating under resistance, with price action showing ongoing weakness and heightened selling pressure near support. Technical indicators highlight a test of support just above $500, with a breakdown risking further losses, while resistance remains significant in the $520–$564 range.


Latest Bitcoin Cash News


-
 Afghanistan
-
 Albania
-
 Algeria
-
 Angola
-
 Argentina
-
 Armenia
-
 Australia
-
 Austria
-
 Azerbaijan
-
 Bahamas
-
 Bahrain
-
 Bangladesh
-
 Belarus
-
 Belgium
-
 Bolivia
-
 Botswana
-
 Brazil
-
 Brunei
-
 Bulgaria
-
 Cambodia
-
 Cameroon
-
 Canada
-
 Chile
Chile
-
 China
China
-
 Colombia
-
 Congo
Congo
-
 Costa Rica
-
 Cote d'Ivoire
-
 Croatia
-
 Cuba
Cuba
-
 Cyprus
-
 Czechia
-
 DR Congo
-
 Denmark
-
 Dominican Republic
-
 Ecuador
-
 Egypt
Egypt
-
 El Salvador
-
 Estonia
-
 Eswatini
-
 Ethiopia
-
 Finland
-
 France
-
 Georgia
-
 Germany
-
 Ghana
Ghana
-
 Greece
-
 Haiti
Haiti
-
 Hong Kong
-
 Hungary
-
 India
India
-
 Indonesia
-
 Iran, Islamic republic
-
 Iraq
Iraq
-
 Ireland
-
 Israel
-
 Italy
Italy
-
 Jamaica
-
 Japan
Japan
-
 Jordan
-
 Kazakhstan
-
 Kenya
Kenya
-
 Korea
Korea
-
 Kuwait
-
 Kyrgyzstan
-
 Laos
Laos
-
 Latvia
-
 Lebanon
-
 Lesotho
-
 Libya
Libya
-
 Lithuania
-
 Luxembourg
-
 Madagascar
-
 Malaysia
-
 Malta
Malta
-
 Mauritius
-
 Mexico
-
 Moldova
-
 Mongolia
-
 Montenegro
-
 Morocco
-
 Mozambique
-
 Myanmar
-
 Namibia
-
 Nepal
Nepal
-
 Netherlands
-
 New Zealand
-
 Nigeria
-
 North Macedonia
-
 Norway
-
 Oman
Oman
-
 Pakistan
-
 Palestine
-
 Panama
-
 Papua New Guinea
-
 Paraguay
-
 Peru
Peru
-
 Philippines
-
 Poland
-
 Portugal
-
 Puerto Rico
-
 Qatar
Qatar
-
 Reunion
-
 Romania
-
 Rwanda
-
 Saudi Arabia
-
 Serbia
-
 Singapore
-
 Slovakia
-
 Slovenia
-
 Somalia
-
 South Africa
-
 Spain
Spain
-
 Sri Lanka
-
 Sweden
-
 Switzerland
-
 Syria
Syria
-
 Taiwan
-
 Tajikistan
-
 Tanzania
-
 Thailand
-
 Trinidad and Tobago
-
 Tunisia
-
 Turkey
-
 UAE
UAE
-
 Uganda
-
 Ukraine
-
 United Kingdom
-
United States
-
 Uruguay
-
 Uzbekistan
-
 Venezuela
-
 Vietnam
-
 Yemen
Yemen
-
 Zambia
-
 Zimbabwe
- Forex
- Crypto
