
Bitcoin Cash price prediction: Can sideways consolidation last? BCH climbs 9.56%

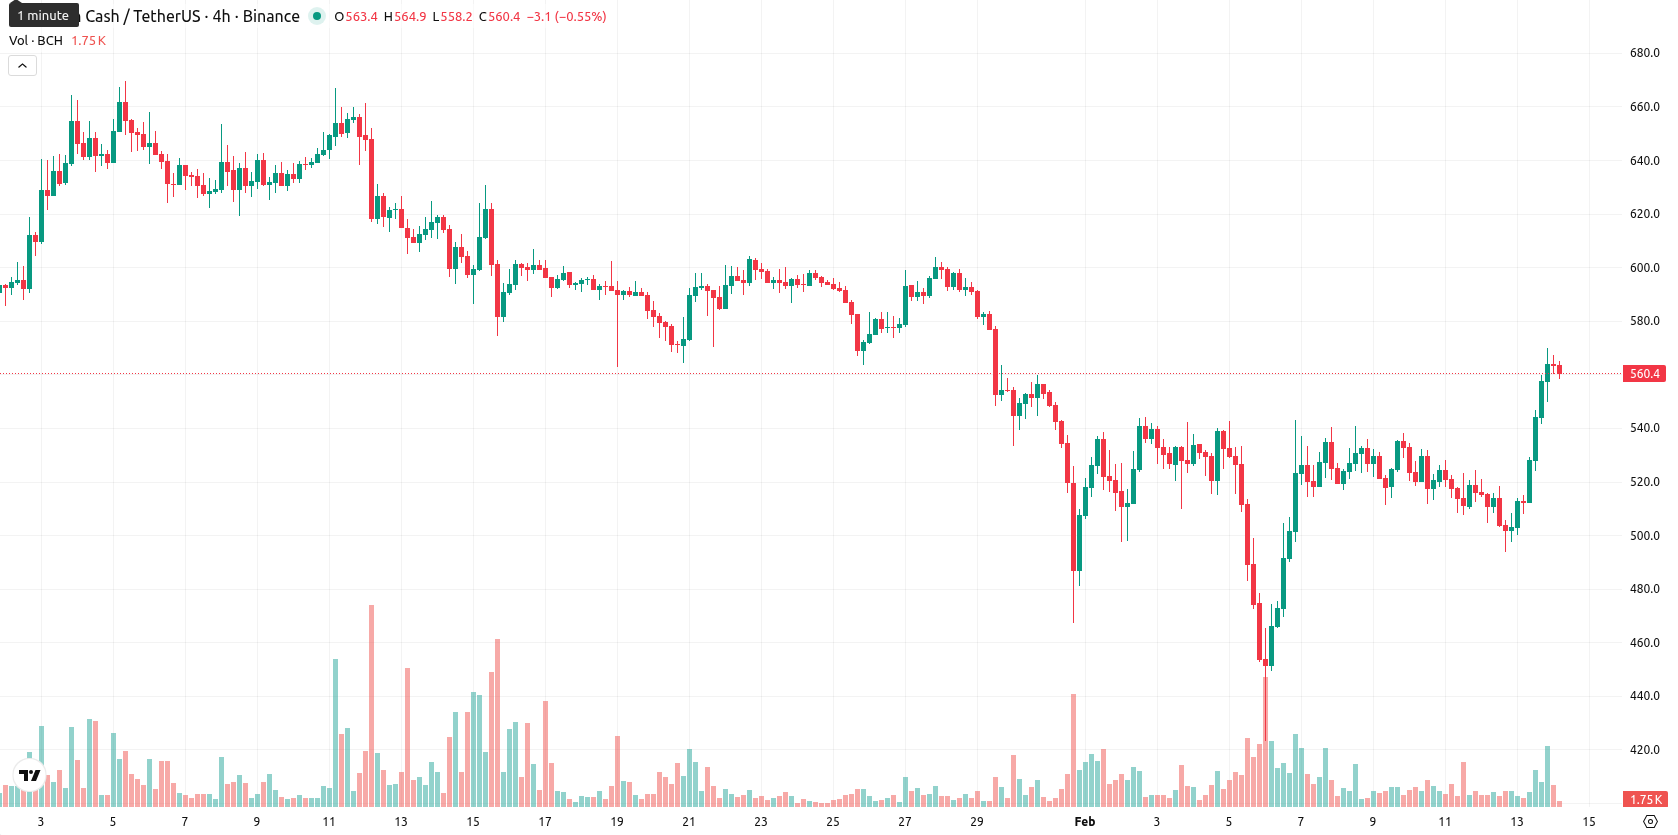
Bitcoin Cash (BCH) is trading at $559.30, above its MA-20 ($537.24), but just below the MA-200 ($561.40) and still under the MA-50 ($581.83). This positioning points to short-term upward momentum while medium-term resistance remains, with the Ichimoku Kijun ($513.50) acting as key dynamic support and MA-50 as the main resistance area.
Highlights
- Bitcoin Cash is trading at $559.30, showing a 9.56% daily gain and sitting above its MA-20 but just below the MA-200 resistance at $561.40.
- Momentum indicators present mixed signals: MACD and ADX favor sellers, while RSI reads 53.74 and Stochastic RSI warns of overbought conditions after buyers dominated today.
- Expected price action for the coming week is sideways within $530–$570, with key resistance at MA-50 ($581.83) and dynamic support around the Ichimoku Kijun ($513.50).
Overbought signals counter price strength amid intraday volatility
Momentum indicators are sending mixed signals for BCH: the MACD on the daily chart strongly supports sellers, while the ADX signals a firm trend and a sell bias. RSI is constructive at 53.74, but both Stochastic RSI and Bull/Bear Power indicate overbought conditions, underlining strong buyer domination today. After a 9.56% daily gain and a gap up at the open, BCH currently sits in the lower middle of today’s range, suggesting intraday volatility and mild selling pressure since the open. Price action strength contrasts with momentum indicators, which point to short-term overextension.
Sideways bias as buy signals limit downside risk
Looking ahead, BCH is expected to move within a typical volatility band of $530 to $570 over the next week. The likelihood of further gains is moderately high, with reduced risk of a deep decline, as three out of four weekly indicators (RSI, MACD, MA-50) signal 'Buy.' Consolidation sideways between $530 and $570 is the base case. A breakout above $570 would signal potential for higher highs, while a drop below $530 could trigger further downward movement.
Previously it was reported that Bitcoin Cash is trading above its short-term moving average, signaling short-term bullish momentum, but remains under pressure from medium- and long-term moving averages, indicating persistent resistance. Daily chart momentum indicators show conflicting signals, with increased intraday volatility and oscillators suggesting a potential rebound while continued selling pressure and dynamic support at $513.50 keep the asset in a volatile consolidation range below near-term resistance.


Latest Bitcoin Cash News


-
 Afghanistan
-
 Albania
-
 Algeria
-
 Angola
-
 Argentina
-
 Armenia
-
 Australia
-
 Austria
-
 Azerbaijan
-
 Bahamas
-
 Bahrain
-
 Bangladesh
-
 Belarus
-
 Belgium
-
 Bolivia
-
 Botswana
-
 Brazil
-
 Brunei
-
 Bulgaria
-
 Cambodia
-
 Cameroon
-
 Canada
-
 Chile
Chile
-
 China
China
-
 Colombia
-
 Congo
Congo
-
 Costa Rica
-
 Cote d'Ivoire
-
 Croatia
-
 Cuba
Cuba
-
 Cyprus
-
 Czechia
-
 DR Congo
-
 Denmark
-
 Dominican Republic
-
 Ecuador
-
 Egypt
Egypt
-
 El Salvador
-
 Estonia
-
 Eswatini
-
 Ethiopia
-
 Finland
-
 France
-
 Georgia
-
 Germany
-
 Ghana
Ghana
-
 Greece
-
 Haiti
Haiti
-
 Hong Kong
-
 Hungary
-
 India
India
-
 Indonesia
-
 Iran, Islamic republic
-
 Iraq
Iraq
-
 Ireland
-
 Israel
-
 Italy
Italy
-
 Jamaica
-
 Japan
Japan
-
 Jordan
-
 Kazakhstan
-
 Kenya
Kenya
-
 Korea
Korea
-
 Kuwait
-
 Kyrgyzstan
-
 Laos
Laos
-
 Latvia
-
 Lebanon
-
 Lesotho
-
 Libya
Libya
-
 Lithuania
-
 Luxembourg
-
 Madagascar
-
 Malaysia
-
 Malta
Malta
-
 Mauritius
-
 Mexico
-
 Moldova
-
 Mongolia
-
 Montenegro
-
 Morocco
-
 Mozambique
-
 Myanmar
-
 Namibia
-
 Nepal
Nepal
-
 Netherlands
-
 New Zealand
-
 Nigeria
-
 North Macedonia
-
 Norway
-
 Oman
Oman
-
 Pakistan
-
 Palestine
-
 Panama
-
 Papua New Guinea
-
 Paraguay
-
 Peru
Peru
-
 Philippines
-
 Poland
-
 Portugal
-
 Puerto Rico
-
 Qatar
Qatar
-
 Reunion
-
 Romania
-
 Rwanda
-
 Saudi Arabia
-
 Serbia
-
 Singapore
-
 Slovakia
-
 Slovenia
-
 Somalia
-
 South Africa
-
 Spain
Spain
-
 Sri Lanka
-
 Sweden
-
 Switzerland
-
 Syria
Syria
-
 Taiwan
-
 Tajikistan
-
 Tanzania
-
 Thailand
-
 Trinidad and Tobago
-
 Tunisia
-
 Turkey
-
 UAE
UAE
-
 Uganda
-
 Ukraine
-
 United Kingdom
-
United States
-
 Uruguay
-
 Uzbekistan
-
 Venezuela
-
 Vietnam
-
 Yemen
Yemen
-
 Zambia
-
 Zimbabwe
- Forex
- Crypto
