

Rocket Pool price prediction: Can $1.94 resistance hold as RPL jumps 7.14%?

Rocket Pool (RPL) is trading at $1.80 after a daily gain of 7.14%. The asset sits above the MA-20 ($1.7260), but remains below the MA-50 ($1.9408) and well under the MA-200 ($3.9634), highlighting short-term bullish momentum, while medium- and long-term technicals point to continued downside pressure as RPL nears resistance at the MA-50 and the Ichimoku Kijun.
RPL price prediction
Current price:
$1.306
-0.074
5.36%
Real-time Data
22:16
Daily range
1.335
 1.384
1.384
Weekly range
1.3550
1.5540
1.5540
Loading...
Highlights
- RPL is trading at $1.80, above the MA-20 ($1.7260) but below both the MA-50 ($1.9408) and MA-200 ($3.9634), signaling mixed momentum across timeframes.
- Technical indicators are conflicted, with MACD flashing a strong sell while ADX denotes trend strength and oscillators indicate overbought conditions after a 7.14% daily gain.
- Expected trading range for the next five days is $1.70 to $1.90, with less than 20% probability of further increases and a sideways or bearish bias prevailing.
Mixed momentum signals as buyers hold near-session highs
Momentum signals present a mixed setup for RPL. The MACD shows a strong sell bias, and the ADX indicates a powerful trend but also a sell signal. The Relative Strength Index is neutral, while the Stochastic RSI and Commodity Channel Index are both signaling overbought conditions. Bull/Bear Power suggests buyers are in control, and today began with a gap up as RPL trades near the session highs within moderate intraday volatility; persistent strength is visible, yet the divergence between momentum and oscillator signals highlights potential for short-term exhaustion.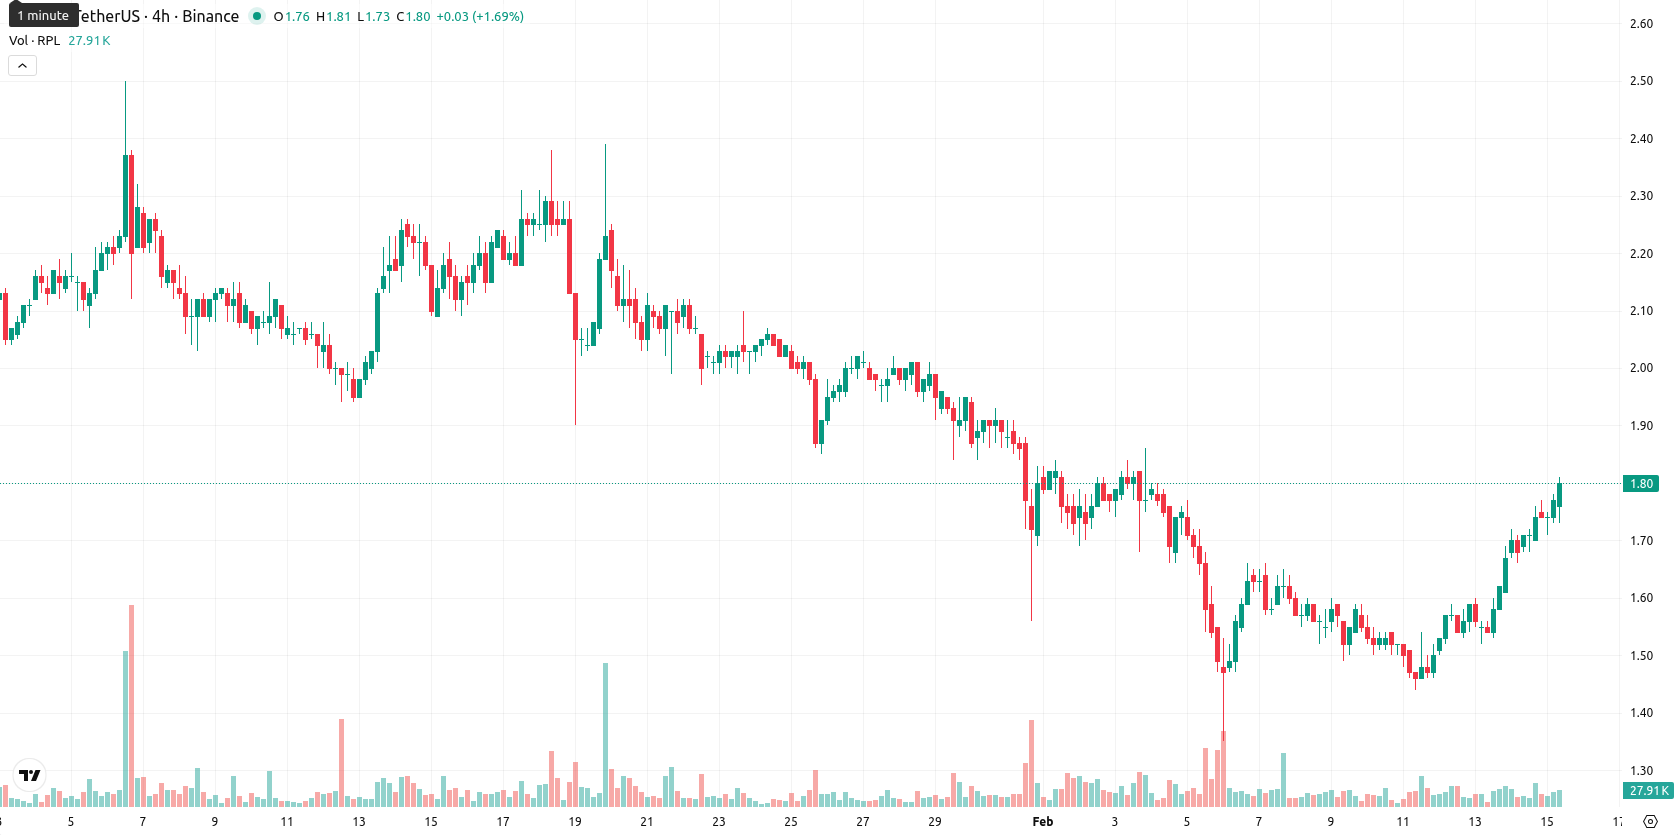
Downside bias as low probability for breakout persists
For the next five trading days, the typical volatility range is expected between $1.70 and $1.90. The probability of a further move higher is low, with less than 20% odds, making a decline more likely in the short term. The baseline scenario is for sideways movement within this volatility band. A break and close above $1.94 could set up a run toward $2.00, while a drop below $1.70 would likely trigger a retest of recent local lows.
Anton Kharitonov, expert at Traders Union, sees Rocket Pool’s short-term strength facing notable resistance from longer-term technical barriers. He highlights that mixed momentum signals and persistent overbought conditions suggest an increased risk of reversal. The analyst remains skeptical of a sustained rally unless RPL convincingly clears the $1.94 level. "Base case remains sideways to lower unless bulls regain control above $1.94 — caution is warranted."
Previously it was reported that Rocket Pool (RPL) continues to trade below key moving averages and dynamic resistance levels, indicating persistent bearish momentum and sustained seller control across multiple timeframes. Momentum indicators remain mixed, with a bearish MACD and non-oversold RSI, while intraday price action diverges with brief buyer strength near session highs against a backdrop of ongoing downside risk.
Source of Data:
RPL Price Analysis by TU
The analysis is based on a proprietary model combining technical, on-chain, and expert data. Not investment advice. See
methodology
The information is based on forecasts and does not constitute investment advice or a guarantee of future results. Market conditions may change. See our Disclaimer and Editorial Integrity for details.
Subscribe to TU news


Did you like the article?






Top News


Top 5 companies for you

United States
-
 Afghanistan
-
 Albania
-
 Algeria
-
 Angola
-
 Argentina
-
 Armenia
-
 Australia
-
 Austria
-
 Azerbaijan
-
 Bahamas
-
 Bahrain
-
 Bangladesh
-
 Belarus
-
 Belgium
-
 Bolivia
-
 Botswana
-
 Brazil
-
 Brunei
-
 Bulgaria
-
 Cambodia
-
 Cameroon
-
 Canada
-
 Chile
-
 China
-
 Colombia
-
 Congo
-
 Costa Rica
-
 Cote d'Ivoire
-
 Croatia
-
 Cuba
-
 Cyprus
-
 Czechia
-
 DR Congo
-
 Denmark
-
 Dominican Republic
-
 Ecuador
-
 Egypt
-
 El Salvador
-
 Estonia
-
 Eswatini
-
 Ethiopia
-
 Finland
-
 France
-
 Georgia
-
 Germany
-
 Ghana
-
 Greece
-
 Haiti
-
 Hong Kong
-
 Hungary
-
 India
-
 Indonesia
-
 Iran, Islamic republic
-
 Iraq
-
 Ireland
-
 Israel
-
 Italy
-
 Jamaica
-
 Japan
-
 Jordan
-
 Kazakhstan
-
 Kenya
-
 Korea
-
 Kuwait
-
 Kyrgyzstan
-
 Laos
-
 Latvia
-
 Lebanon
-
 Lesotho
-
 Libya
-
 Lithuania
-
 Luxembourg
-
 Madagascar
-
 Malaysia
-
 Malta
-
 Mauritius
-
 Mexico
-
 Moldova
-
 Mongolia
-
 Montenegro
-
 Morocco
-
 Mozambique
-
 Myanmar
-
 Namibia
-
 Nepal
-
 Netherlands
-
 New Zealand
-
 Nigeria
-
 North Macedonia
-
 Norway
-
 Oman
-
 Pakistan
-
 Palestine
-
 Panama
-
 Papua New Guinea
-
 Paraguay
-
 Peru
-
 Philippines
-
 Poland
-
 Portugal
-
 Puerto Rico
-
 Qatar
-
 Reunion
-
 Romania
-
 Rwanda
-
 Saudi Arabia
-
 Serbia
-
 Singapore
-
 Slovakia
-
 Slovenia
-
 Somalia
-
 South Africa
-
 Spain
-
 Sri Lanka
-
 Sweden
-
 Switzerland
-
 Syria
-
 Taiwan
-
 Tajikistan
-
 Tanzania
-
 Thailand
-
 Trinidad and Tobago
-
 Tunisia
-
 Turkey
-
 UAE
-
 Uganda
-
 Ukraine
-
 United Kingdom
-
United States
-
 Uruguay
-
 Uzbekistan
-
 Venezuela
-
 Vietnam
-
 Yemen
-
 Zambia
-
 Zimbabwe
- Forex
- Crypto










Live News


