
VET slides below major support levels as sellers dominate and indicators suggest high probability of further losses – weekly report

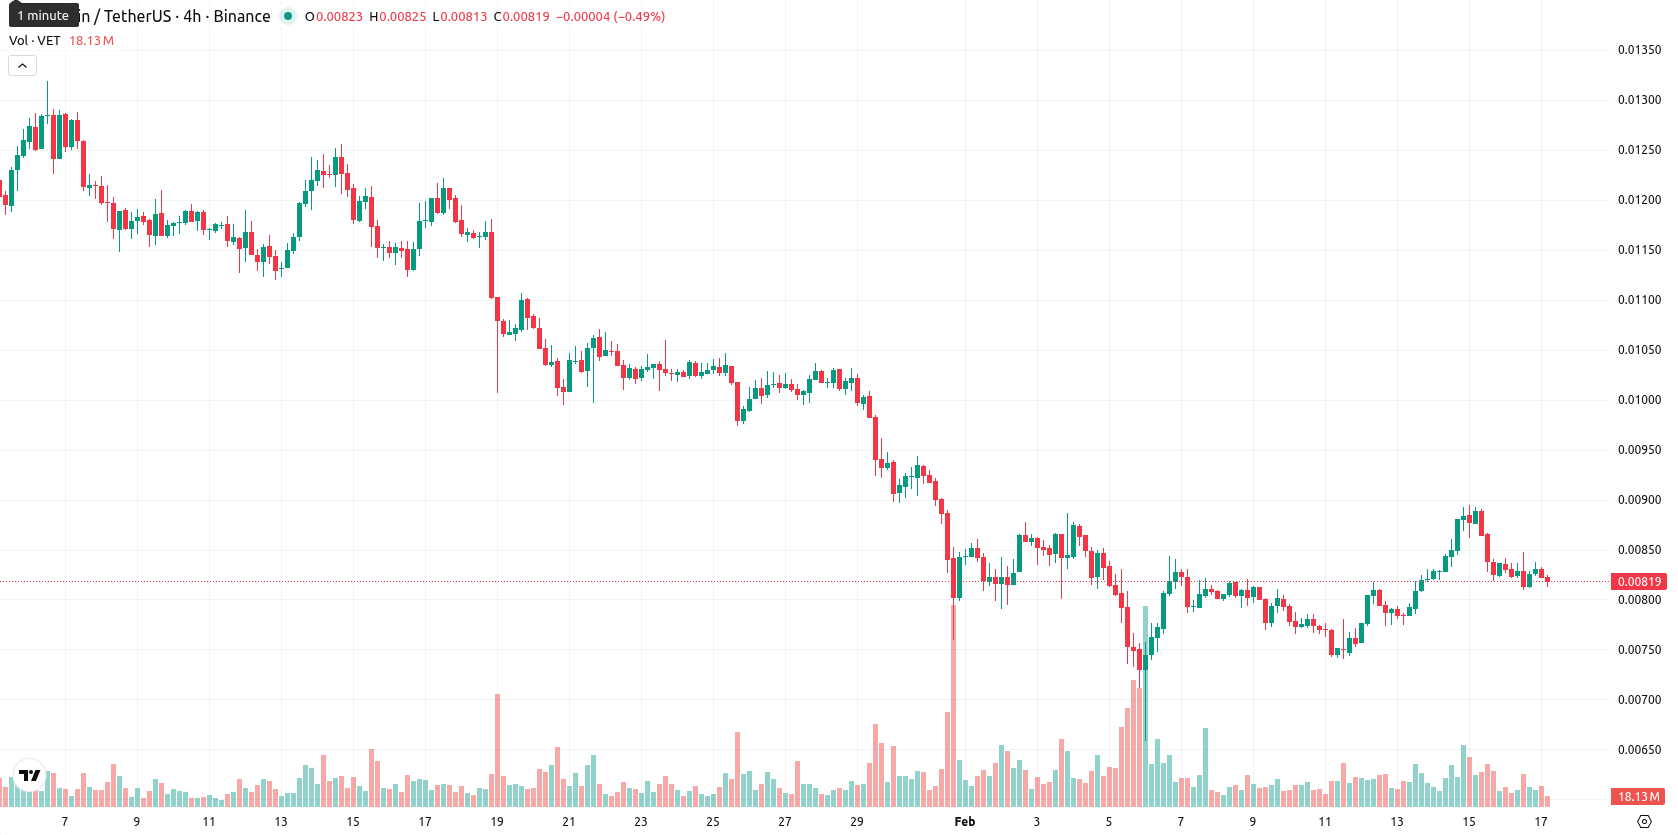
VeChain (VET) is currently priced at $0.00818, having slipped 0.81% over the past week. The asset remains under pressure, trading below its weekly MA-20 ($0.00836690), MA-50 ($0.01009396), and MA-200 ($0.01665944), which signals sustained weakness and prevailing bearish momentum on the weekly timeframe.
Highlights
- VeChain (VET) trades at $0.00818 below MA-20 ($0.00837), MA-50 ($0.01009), and MA-200 ($0.01666), indicating persistent multi-term downward pressure.
- Momentum signals are firmly bearish with MACD and ADX confirming strong selling, while RSI at 43.56 and Stochastic RSI at 79 show no immediate oversold condition.
- Key dynamic support lies at $0.00863 (Kijun), resistance at MA-20/MA-50, and the likely price corridor for the next five days is $0.00740–$0.00870 with >80% probability of downside continuation.
Bearish technical posture deepens as VET stays under long-term resistance
On the weekly chart, VET trades below all major weekly moving averages with the MA-20, MA-50, and MA-200 serving as overhead resistance levels. Nearest dynamic support sits at the Ichimoku Kijun around $0.00863, while resistance is likely to be encountered near the MA-20 and MA-50 as the price remains well below these benchmarks. Weekly momentum indicators are bearish overall: the RSI (W1) is at 43.56 and trending weaker, while the CCI is neutral. Despite some intraday buy signals from Bull/Bear Power, the Awesome Oscillator is neutral, and the MACD and ADX point to continued selling pressure.
Sideways bias likely this week as range boundaries face breakout risk
For the next five to seven trading days, the most probable scenario is for VET to continue trading sideways within a $0.00740 – $0.00870 range as bulls and bears test the boundaries. A breakout above $0.00870 would be required for any upside momentum to develop, while a drop below $0.00740 could open the way to further declines toward recent lows. Based on weekly indicators, there is a high probability of further price pressure, with bearish outcomes more likely amid the current technical setup.
Last time, analysts noted that VeChain is trading firmly below all major moving averages, with bearish momentum reinforced by negative oscillator readings and persistent selling pressure. The asset faces key resistance at the Ichimoku Kijun and limited support just above intraday lows, while technical indicators such as the MACD, ADX, and RSI all point to weak buying interest and elevated downside risk.


Latest VeChain News


-
 Afghanistan
-
 Albania
-
 Algeria
-
 Angola
-
 Argentina
-
 Armenia
-
 Australia
-
 Austria
-
 Azerbaijan
-
 Bahamas
-
 Bahrain
-
 Bangladesh
-
 Belarus
-
 Belgium
-
 Bolivia
-
 Botswana
-
 Brazil
-
 Brunei
-
 Bulgaria
-
 Cambodia
-
 Cameroon
-
 Canada
-
 Chile
Chile
-
 China
China
-
 Colombia
-
 Congo
Congo
-
 Costa Rica
-
 Cote d'Ivoire
-
 Croatia
-
 Cuba
Cuba
-
 Cyprus
-
 Czechia
-
 DR Congo
-
 Denmark
-
 Dominican Republic
-
 Ecuador
-
 Egypt
Egypt
-
 El Salvador
-
 Estonia
-
 Eswatini
-
 Ethiopia
-
 Finland
-
 France
-
 Georgia
-
 Germany
-
 Ghana
Ghana
-
 Greece
-
 Haiti
Haiti
-
 Hong Kong
-
 Hungary
-
 India
India
-
 Indonesia
-
 Iran, Islamic republic
-
 Iraq
Iraq
-
 Ireland
-
 Israel
-
 Italy
Italy
-
 Jamaica
-
 Japan
Japan
-
 Jordan
-
 Kazakhstan
-
 Kenya
Kenya
-
 Korea
Korea
-
 Kuwait
-
 Kyrgyzstan
-
 Laos
Laos
-
 Latvia
-
 Lebanon
-
 Lesotho
-
 Libya
Libya
-
 Lithuania
-
 Luxembourg
-
 Madagascar
-
 Malaysia
-
 Malta
Malta
-
 Mauritius
-
 Mexico
-
 Moldova
-
 Mongolia
-
 Montenegro
-
 Morocco
-
 Mozambique
-
 Myanmar
-
 Namibia
-
 Nepal
Nepal
-
 Netherlands
-
 New Zealand
-
 Nigeria
-
 North Macedonia
-
 Norway
-
 Oman
Oman
-
 Pakistan
-
 Palestine
-
 Panama
-
 Papua New Guinea
-
 Paraguay
-
 Peru
Peru
-
 Philippines
-
 Poland
-
 Portugal
-
 Puerto Rico
-
 Qatar
Qatar
-
 Reunion
-
 Romania
-
 Rwanda
-
 Saudi Arabia
-
 Serbia
-
 Singapore
-
 Slovakia
-
 Slovenia
-
 Somalia
-
 South Africa
-
 Spain
Spain
-
 Sri Lanka
-
 Sweden
-
 Switzerland
-
 Syria
Syria
-
 Taiwan
-
 Tajikistan
-
 Tanzania
-
 Thailand
-
 Trinidad and Tobago
-
 Tunisia
-
 Turkey
-
 UAE
UAE
-
 Uganda
-
 Ukraine
-
 United Kingdom
-
United States
-
 Uruguay
-
 Uzbekistan
-
 Venezuela
-
 Vietnam
-
 Yemen
Yemen
-
 Zambia
-
 Zimbabwe
- Forex
- Crypto
