
VeChain declines as it trades below important short-term averages

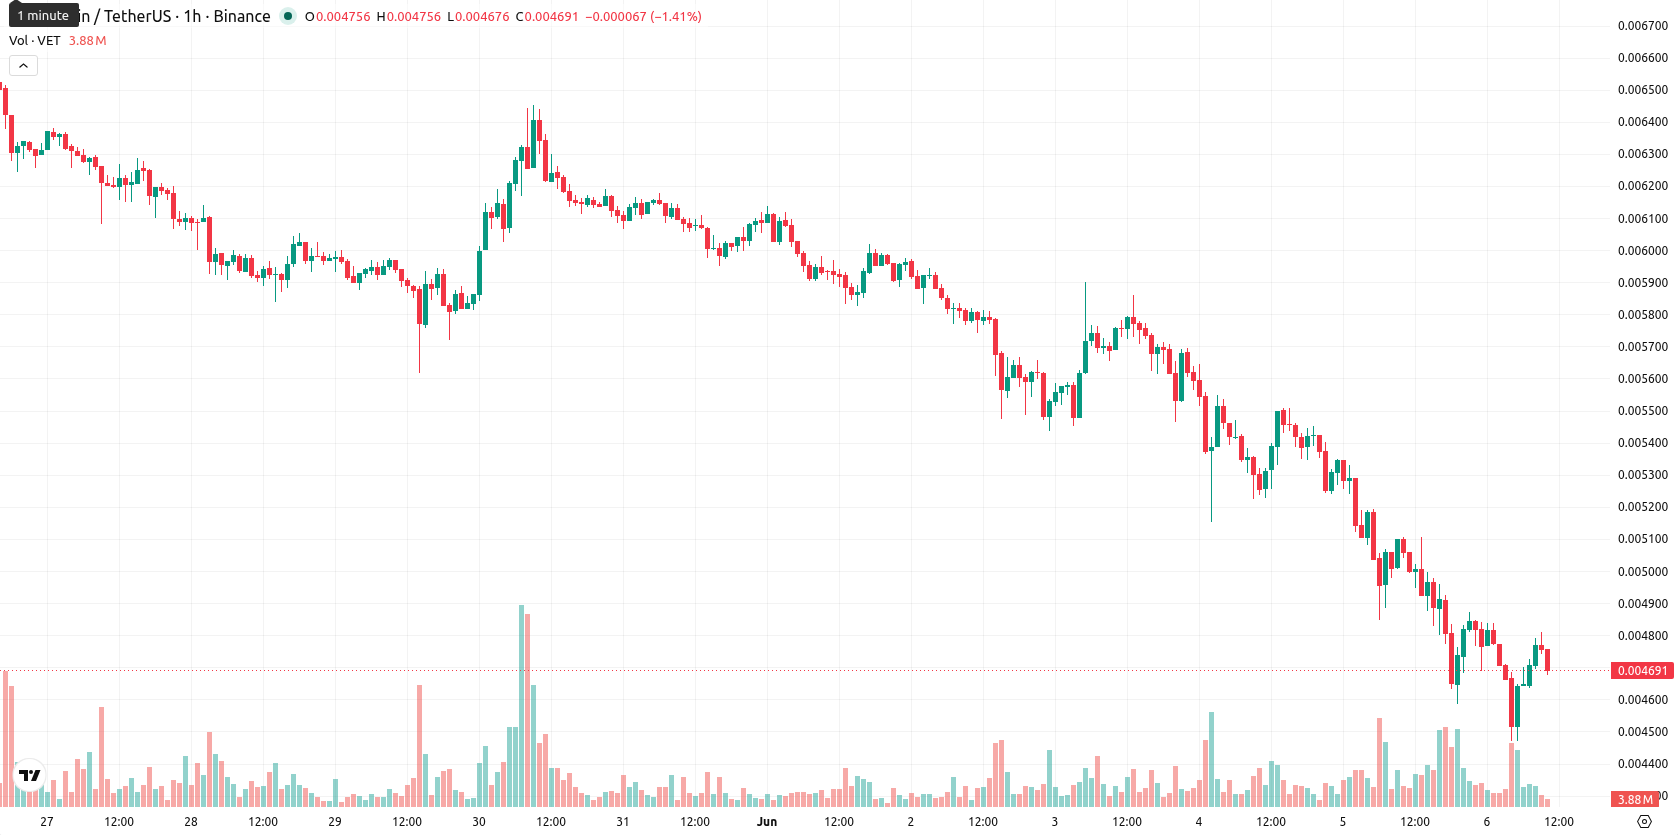
VeChain (VET) is trading at $0.00469400, down 7.43% on the day with high intraday volatility. The price sits below its key moving averages, reflecting persistent downward momentum.
Highlights
- VeChain continues to see real-world enterprise adoption in supply chain, logistics, and product verification, supporting underlying demand for its blockchain platform.
- A growing institutional user base and a proven business model strengthen VeChain’s commercial profile despite ongoing market pressures.
- VET/USD trades below key moving averages with bearish technical momentum, a projected range of $0.00433824–$0.00504976, and a 67% probability of further downside.
Enterprise adoption rises as price lags amid selling pressure
News.abplive.com reported that VeChain’s blockchain platform has seen increasing enterprise use in supply chain management, logistics, and product authentication, confirming concrete industry adoption. These developments contribute to the token’s fundamental demand by connecting VeChain’s technology with real-world applications among enterprise clients. The project’s proven business model and expanding base of institutional users further improve commercial visibility, though price action has remained under broader selling pressure.
Bearish momentum holds as short-term signals diverge at resistance
VET/USD is trading below the MA-20 ($0.00476805) and MA-50 ($0.00504982) on the H1 chart, with the long-term MA-200 positioned much higher at $0.00885579. The Ichimoku Kijun at $0.00478750 represents immediate resistance. Oscillator and momentum indicators show a mixed picture: MACD is on Strong Sell and ADX on Sell, indicating clear downward momentum, while RSI registers 47.36 in a Sell zone and Stoch RSI is Overbought. The Commodity Channel Index (CCI) is Neutral, Bull/Bear Power (BBP) is tagged Strong Buy, and Awesome Oscillator (AO) remains Neutral, reflecting divergent short-term signals within a broader bearish setup.
Range-bound outlook persists as downside probability outweighs rebound
In the short term, VET/USD is expected to trade within the $0.00433824 to $0.00504976 volatility band relative to current levels. Probability models suggest a 33% chance of a near-term up move versus a 67% likelihood of continued downside. The baseline scenario envisions range-bound price action. A decisive break above resistance at $0.00478750 would be required to shift toward a bullish bias, while a move below the $0.00433824 support zone could accelerate further declines.
Earlier, analysts noted that VeChain was under sustained bearish momentum with little sign of an imminent recovery. The current divergence in short-term indicators—amid persistent selling pressure and fundamental adoption headlines—signals traders should closely watch for a decisive break above $0.00478750 resistance or a fall below the $0.00433824 support, either of which could shape the next major trend direction.


-
 Afghanistan
-
 Albania
-
 Algeria
-
 Angola
-
 Argentina
-
 Armenia
-
 Australia
-
 Austria
-
 Azerbaijan
-
 Bahamas
-
 Bahrain
-
 Bangladesh
-
 Belarus
-
 Belgium
-
 Bolivia
-
 Botswana
-
 Brazil
-
 Brunei
-
 Bulgaria
-
 Cambodia
-
 Cameroon
-
 Canada
-
 Chile
Chile
-
 China
China
-
 Colombia
-
 Congo
Congo
-
 Costa Rica
-
 Cote d'Ivoire
-
 Croatia
-
 Cuba
Cuba
-
 Cyprus
-
 Czechia
-
 DR Congo
-
 Denmark
-
 Dominican Republic
-
 Ecuador
-
 Egypt
Egypt
-
 El Salvador
-
 Estonia
-
 Eswatini
-
 Ethiopia
-
 Finland
-
 France
-
 Georgia
-
 Germany
-
 Ghana
Ghana
-
 Greece
-
 Haiti
Haiti
-
 Hong Kong
-
 Hungary
-
 India
India
-
 Indonesia
-
 Iran, Islamic republic
-
 Iraq
Iraq
-
 Ireland
-
 Israel
-
 Italy
Italy
-
 Jamaica
-
 Japan
Japan
-
 Jordan
-
 Kazakhstan
-
 Kenya
Kenya
-
 Korea
Korea
-
 Kuwait
-
 Kyrgyzstan
-
 Laos
Laos
-
 Latvia
-
 Lebanon
-
 Lesotho
-
 Libya
Libya
-
 Lithuania
-
 Luxembourg
-
 Madagascar
-
 Malaysia
-
 Malta
Malta
-
 Mauritius
-
 Mexico
-
 Moldova
-
 Mongolia
-
 Montenegro
-
 Morocco
-
 Mozambique
-
 Myanmar
-
 Namibia
-
 Nepal
Nepal
-
 Netherlands
-
 New Zealand
-
 Nigeria
-
 North Macedonia
-
 Norway
-
 Oman
Oman
-
 Pakistan
-
 Palestine
-
 Panama
-
 Papua New Guinea
-
 Paraguay
-
 Peru
Peru
-
 Philippines
-
 Poland
-
 Portugal
-
 Puerto Rico
-
 Qatar
Qatar
-
 Reunion
-
 Romania
-
 Rwanda
-
 Saudi Arabia
-
 Serbia
-
 Singapore
-
 Slovakia
-
 Slovenia
-
 Somalia
-
 South Africa
-
 Spain
Spain
-
 Sri Lanka
-
 Sweden
-
 Switzerland
-
 Syria
Syria
-
 Taiwan
-
 Tajikistan
-
 Tanzania
-
 Thailand
-
 Trinidad and Tobago
-
 Tunisia
-
 Turkey
-
 UAE
UAE
-
 Uganda
-
 Ukraine
-
 United Kingdom
-
United States
-
 Uruguay
-
 Uzbekistan
-
 Venezuela
-
 Vietnam
-
 Yemen
Yemen
-
 Zambia
-
 Zimbabwe
- Forex
- Crypto
