
VeChain trades sideways with resistance at $0.00512 limiting upside: weekly review

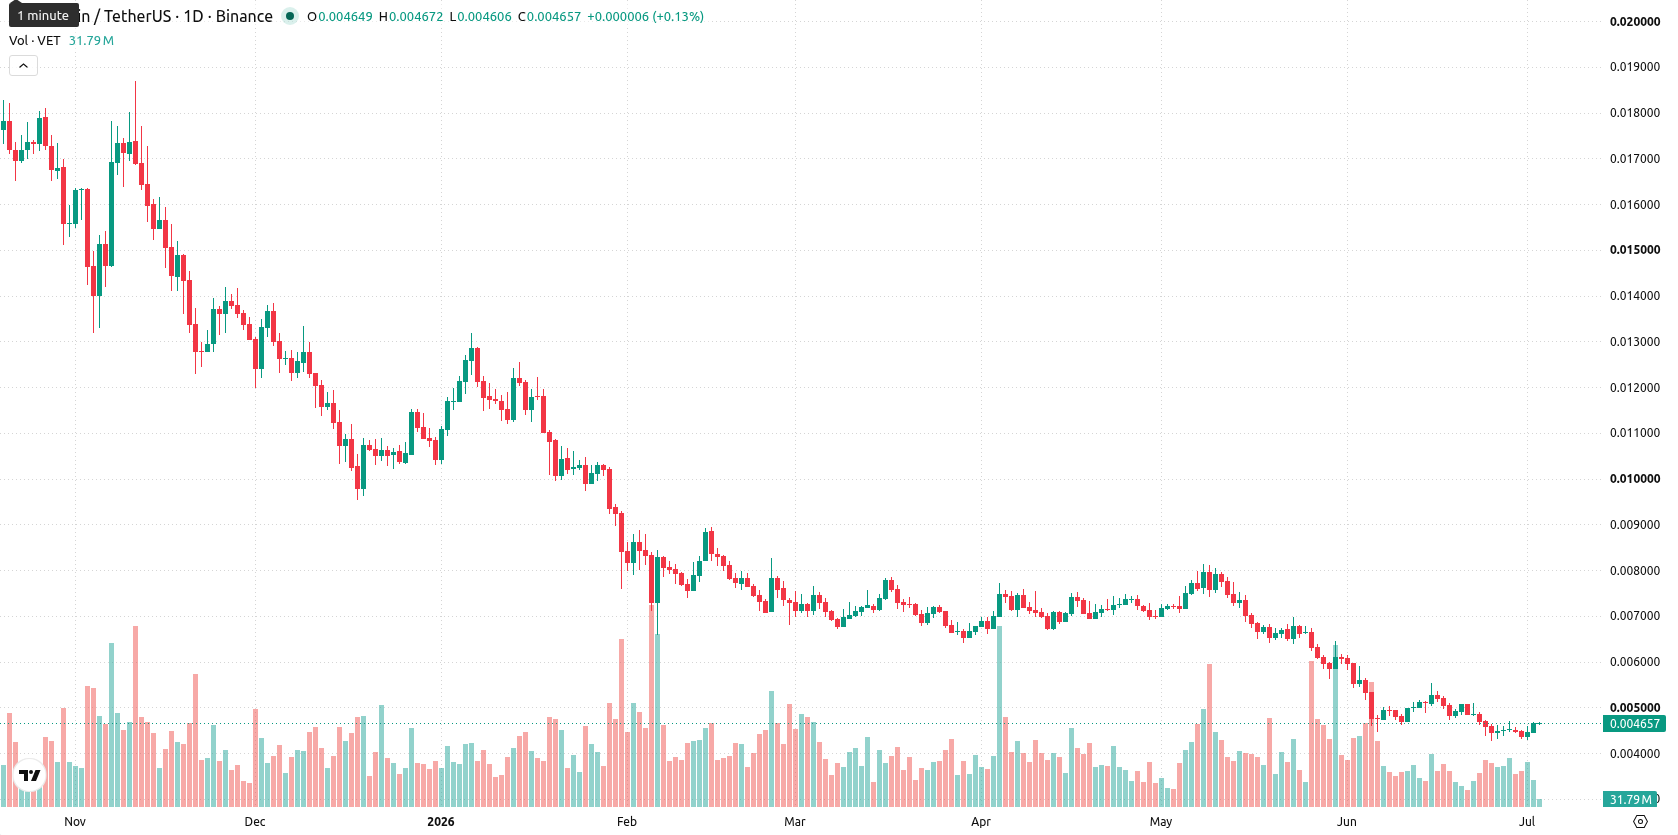
VeChain (VET) has posted a modest gain of $0.000085 (1.86%) over the past week, positioning at the very top of its weekly range. The price remains well below the MA-20 ($0.00646060), MA-50 ($0.01279464), and MA-200 ($0.02335521) on the weekly (W1) chart, underscoring sustained downward pressure from sellers.
Highlights
- VeChain remains in a pronounced bearish trend, trading below key moving averages and facing persistent selling pressure.
- Weekly technical indicators show deep oversold readings but no confirmed reversal, indicating sellers still dominate momentum.
- Price is expected to move sideways between $0.00420 and $0.00512, with a low probability of significant upside this week.
Bearish technical momentum persists as oversold signals fail to reverse trend
Weekly technical indicators confirm a persistently bearish structure for VET: the price is beneath all major weekly moving averages, and the nearest dynamic resistance is reinforced by the Ichimoku Kijun and key MAs. The MACD and ADX both signal strong selling momentum, while RSI, CCI, and Stochastic RSI remain deeply oversold, hinting at possible relief but with no confirmation of a trend reversal. Bull/Bear Power continues negative, and the Awesome Oscillator is neutral, providing no decisive support for buyers. Volatility was elevated at 9.82%, with VET ending the period near resistance.
Sideways range expected as strong resistance limits breakout risk this week
Looking ahead over the next 7 days, VeChain is likely to trade within a sideways corridor between $0.00420 and $0.00512, reflecting the current technical and momentum setup on the weekly chart. The probability of significant upward movement remains extremely low (less than 20%) as no major indicator signals a buy. If VET breaks above $0.00512, a brief short-term squeeze is possible, yet upside will be limited by heavy resistance. On the downside, a retreat below $0.00420 could lead to further declines and establish new lows should selling intensify.
Earlier, analysts noted that VeChain was entrenched in a bearish trend with little sign of a near-term reversal. The latest technical signals not only reaffirm this outlook but also highlight the crucial importance of monitoring for a sustained move above $0.00512 or a breakdown below $0.00420 as triggers for the next directional shift.


-
 Afghanistan
-
 Albania
-
 Algeria
-
 Angola
-
 Argentina
-
 Armenia
-
 Australia
-
 Austria
-
 Azerbaijan
-
 Bahamas
-
 Bahrain
-
 Bangladesh
-
 Belarus
-
 Belgium
-
 Bolivia
-
 Botswana
-
 Brazil
-
 Brunei
-
 Bulgaria
-
 Cambodia
-
 Cameroon
-
 Canada
-
 Chile
Chile
-
 China
China
-
 Colombia
-
 Congo
Congo
-
 Costa Rica
-
 Cote d'Ivoire
-
 Croatia
-
 Cuba
Cuba
-
 Cyprus
-
 Czechia
-
 DR Congo
-
 Denmark
-
 Dominican Republic
-
 Ecuador
-
 Egypt
Egypt
-
 El Salvador
-
 Estonia
-
 Eswatini
-
 Ethiopia
-
 Finland
-
 France
-
 Georgia
-
 Germany
-
 Ghana
Ghana
-
 Greece
-
 Haiti
Haiti
-
 Hong Kong
-
 Hungary
-
 India
India
-
 Indonesia
-
 Iran, Islamic republic
-
 Iraq
Iraq
-
 Ireland
-
 Israel
-
 Italy
Italy
-
 Jamaica
-
 Japan
Japan
-
 Jordan
-
 Kazakhstan
-
 Kenya
Kenya
-
 Korea
Korea
-
 Kuwait
-
 Kyrgyzstan
-
 Laos
Laos
-
 Latvia
-
 Lebanon
-
 Lesotho
-
 Libya
Libya
-
 Lithuania
-
 Luxembourg
-
 Madagascar
-
 Malaysia
-
 Malta
Malta
-
 Mauritius
-
 Mexico
-
 Moldova
-
 Mongolia
-
 Montenegro
-
 Morocco
-
 Mozambique
-
 Myanmar
-
 Namibia
-
 Nepal
Nepal
-
 Netherlands
-
 New Zealand
-
 Nigeria
-
 North Macedonia
-
 Norway
-
 Oman
Oman
-
 Pakistan
-
 Palestine
-
 Panama
-
 Papua New Guinea
-
 Paraguay
-
 Peru
Peru
-
 Philippines
-
 Poland
-
 Portugal
-
 Puerto Rico
-
 Qatar
Qatar
-
 Reunion
-
 Romania
-
 Rwanda
-
 Saudi Arabia
-
 Serbia
-
 Singapore
-
 Slovakia
-
 Slovenia
-
 Somalia
-
 South Africa
-
 Spain
Spain
-
 Sri Lanka
-
 Sweden
-
 Switzerland
-
 Syria
Syria
-
 Taiwan
-
 Tajikistan
-
 Tanzania
-
 Thailand
-
 Trinidad and Tobago
-
 Tunisia
-
 Turkey
-
 UAE
UAE
-
 Uganda
-
 Ukraine
-
 United Kingdom
-
United States
-
 Uruguay
-
 Uzbekistan
-
 Venezuela
-
 Vietnam
-
 Yemen
Yemen
-
 Zambia
-
 Zimbabwe
- Forex
- Crypto
