

Momentum surges despite overbought risks — Rocket Pool gains 10.36%

Rocket Pool (RPL) is trading at $2.45, remaining above both its 20-day ($1.77) and 50-day ($1.96) Moving Averages, but still well under the 200-day ($3.87). This highlights a short- and medium-term bullish trend within a longer-term bearish structure.
RPL price prediction
Current price:
$1.347
-0.035
2.53%
Real-time Data
19:35
Daily range
1.335
 1.384
1.384
Weekly range
1.3550
1.5540
1.5540
Loading...
Highlights
- RPL is trading at $2.45, above its 20-day ($1.77) and 50-day ($1.96) moving averages, signaling a near-term bullish trend despite a longer-term bearish outlook below the 200-day ($3.87).
- Momentum indicators (ADX, intraday MACD, Bull/Bear Power) show robust upward strength, but overbought conditions via RSI and CCI and neutral oscillators signal increased risk of a short-term reversal.
- Key technical levels for the coming week are support at $2.30 (Ichimoku Kijun) and $1.96 (50-day MA), resistance at $2.50, and a projected trading range of $2.39–$2.49 with downside risk prevailing.
Overbought signals and mixed momentum as price nears resistance
The nearest dynamic levels are the Ichimoku Kijun at $2.30 as support and the 50-day Moving Average acting as the next level of support, while short-term resistance forms near round levels such as $2.50. Momentum signals are robust with the ADX showing strong upward strength and the MACD neutral on the daily chart, but having a supportive tone on intraday frames. The RSI and CCI suggest the market is pushing into overbought territory, while the Stochastic RSI remains neutral. Bull/Bear Power signals that buyers currently dominate, consistent with strong intraday price gains. The Awesome Oscillator is neutral but does not contradict today's uptrend. The session experienced no significant gap at the open, and price action is now near the upper end of today’s range ($2.19 — $2.74), reflecting high volatility and persistent strength after the open. While momentum and buyer dominance support the climb, the increasing signs of overbought conditions and some neutral oscillators highlight a growing divergence that could lead to short-term pauses or reversals.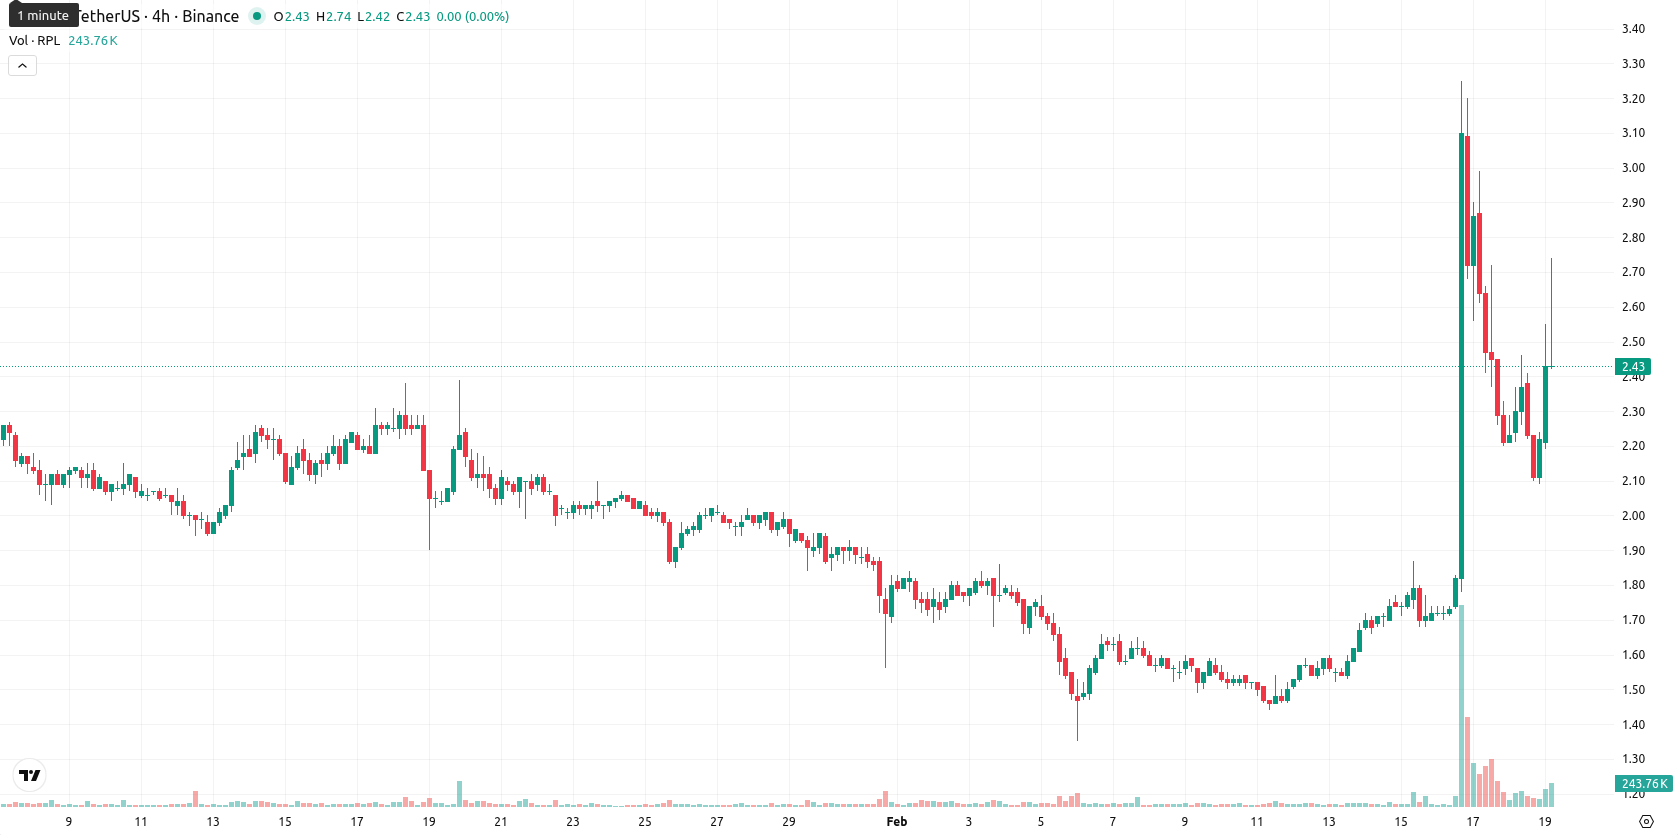
Downside favored as technicals weigh against further upside
For the coming week, the expected price corridor sits between $2.39 and $2.49, comfortably bracketing the current price and reflecting typical volatility relative to current levels. Based on the broader weekly technicals — where most momentum and trend indicators (including weekly MACD, RSI, and Moving Averages) remain set to Sell or Strong Sell — there is a very low probability (less than 20%) of a sustained price increase, making a decline more likely. Baseline scenario: RPL fluctuates within this narrow band as bulls and bears battle for direction. Bullish scenario: a confident move above $2.50 could trigger a follow-on rally toward $2.60. Bearish scenario: a fall below $2.39 may accelerate profit-taking and push the price closer to the $2.30 Ichimoku Kijun support.
Anton Kharitonov, expert at Traders Union, sees Rocket Pool locked in a short- and medium-term bullish trend but within a dominant long-term downtrend. He notes that buyers are currently in control, yet momentum oscillators flashing overbought warn of looming reversals or pauses. Kharitonov remains skeptical of a sustained upward move given most weekly technicals favor further downside. "Unless RPL breaks out solidly above $2.50, I expect market gains to fade and sellers to step back in soon."
Last time, analysts noted that Rocket Pool trades above its short- and medium-term moving averages, signaling ongoing bullish momentum, but remains under pressure from the longer-term trend. The asset faces resistance near $2.30, with mixed momentum and oscillator readings indicating indecision and the potential for range-bound consolidation in the near term.
Source of Data:
RPL Price Analysis by TU
The analysis is based on a proprietary model combining technical, on-chain, and expert data. Not investment advice. See
methodology
The information is based on forecasts and does not constitute investment advice or a guarantee of future results. Market conditions may change. See our Disclaimer and Editorial Integrity for details.
Subscribe to TU news


Did you like the article?






Top News


Top 5 companies for you

United States
-
 Afghanistan
-
 Albania
-
 Algeria
-
 Angola
-
 Argentina
-
 Armenia
-
 Australia
-
 Austria
-
 Azerbaijan
-
 Bahamas
-
 Bahrain
-
 Bangladesh
-
 Belarus
-
 Belgium
-
 Bolivia
-
 Botswana
-
 Brazil
-
 Brunei
-
 Bulgaria
-
 Cambodia
-
 Cameroon
-
 Canada
-
 Chile
-
 China
-
 Colombia
-
 Congo
-
 Costa Rica
-
 Cote d'Ivoire
-
 Croatia
-
 Cuba
-
 Cyprus
-
 Czechia
-
 DR Congo
-
 Denmark
-
 Dominican Republic
-
 Ecuador
-
 Egypt
-
 El Salvador
-
 Estonia
-
 Eswatini
-
 Ethiopia
-
 Finland
-
 France
-
 Georgia
-
 Germany
-
 Ghana
-
 Greece
-
 Haiti
-
 Hong Kong
-
 Hungary
-
 India
-
 Indonesia
-
 Iran, Islamic republic
-
 Iraq
-
 Ireland
-
 Israel
-
 Italy
-
 Jamaica
-
 Japan
-
 Jordan
-
 Kazakhstan
-
 Kenya
-
 Korea
-
 Kuwait
-
 Kyrgyzstan
-
 Laos
-
 Latvia
-
 Lebanon
-
 Lesotho
-
 Libya
-
 Lithuania
-
 Luxembourg
-
 Madagascar
-
 Malaysia
-
 Malta
-
 Mauritius
-
 Mexico
-
 Moldova
-
 Mongolia
-
 Montenegro
-
 Morocco
-
 Mozambique
-
 Myanmar
-
 Namibia
-
 Nepal
-
 Netherlands
-
 New Zealand
-
 Nigeria
-
 North Macedonia
-
 Norway
-
 Oman
-
 Pakistan
-
 Palestine
-
 Panama
-
 Papua New Guinea
-
 Paraguay
-
 Peru
-
 Philippines
-
 Poland
-
 Portugal
-
 Puerto Rico
-
 Qatar
-
 Reunion
-
 Romania
-
 Rwanda
-
 Saudi Arabia
-
 Serbia
-
 Singapore
-
 Slovakia
-
 Slovenia
-
 Somalia
-
 South Africa
-
 Spain
-
 Sri Lanka
-
 Sweden
-
 Switzerland
-
 Syria
-
 Taiwan
-
 Tajikistan
-
 Tanzania
-
 Thailand
-
 Trinidad and Tobago
-
 Tunisia
-
 Turkey
-
 UAE
-
 Uganda
-
 Ukraine
-
 United Kingdom
-
United States
-
 Uruguay
-
 Uzbekistan
-
 Venezuela
-
 Vietnam
-
 Yemen
-
 Zambia
-
 Zimbabwe
- Forex
- Crypto










Live News


