

Render surges 7.72% as token utility and ecosystem expansion drive fresh buying

Render (RENDER) is currently trading at $1.493, standing above the MA-20 ($1.4190) but below the MA-50 ($1.8022) and well below the MA-200 ($2.4851). This positioning suggests some short-term recovery, but medium- and long-term trends remain under pressure from sellers, while the Ichimoku Kijun at $1.5720 acts as immediate resistance.
RENDER price prediction
Current price:
$1.291
-0.026
1.97%
Real-time Data
13:30
Daily range
1.19
 1.286
1.286
Weekly range
1.2310
1.4960
1.4960
Loading...
Highlights
- Render Network has become a major player in decentralized GPU cloud computing, with its RENDER token now central to a global operational ecosystem.
- Recent governance proposals like RNP-006, RNP-013, and RNP-015 have improved tokenomics and expanded utility for AI compute, driving growing adoption in the DePIN sector.
- RENDER trades at $1.493, with immediate resistance at $1.57 and support at $1.30, while technical indicators signal ongoing bearish momentum despite recent intraday strength.
Expanding DePIN utility and token adoption as governance shifts emissions
Recent news confirms that the Render Network has become a significant participant in decentralized GPU cloud computing. Its native token, RENDER, now powers a global ecosystem, with operational updates indicating that token usage directly removes tokens from circulation. Governance proposals such as RNP-006, RNP-013, and RNP-015 have refined the emissions model and expanded utility, especially for AI compute workloads, and adoption metrics highlight the growing use case amid increased DePIN sector activity.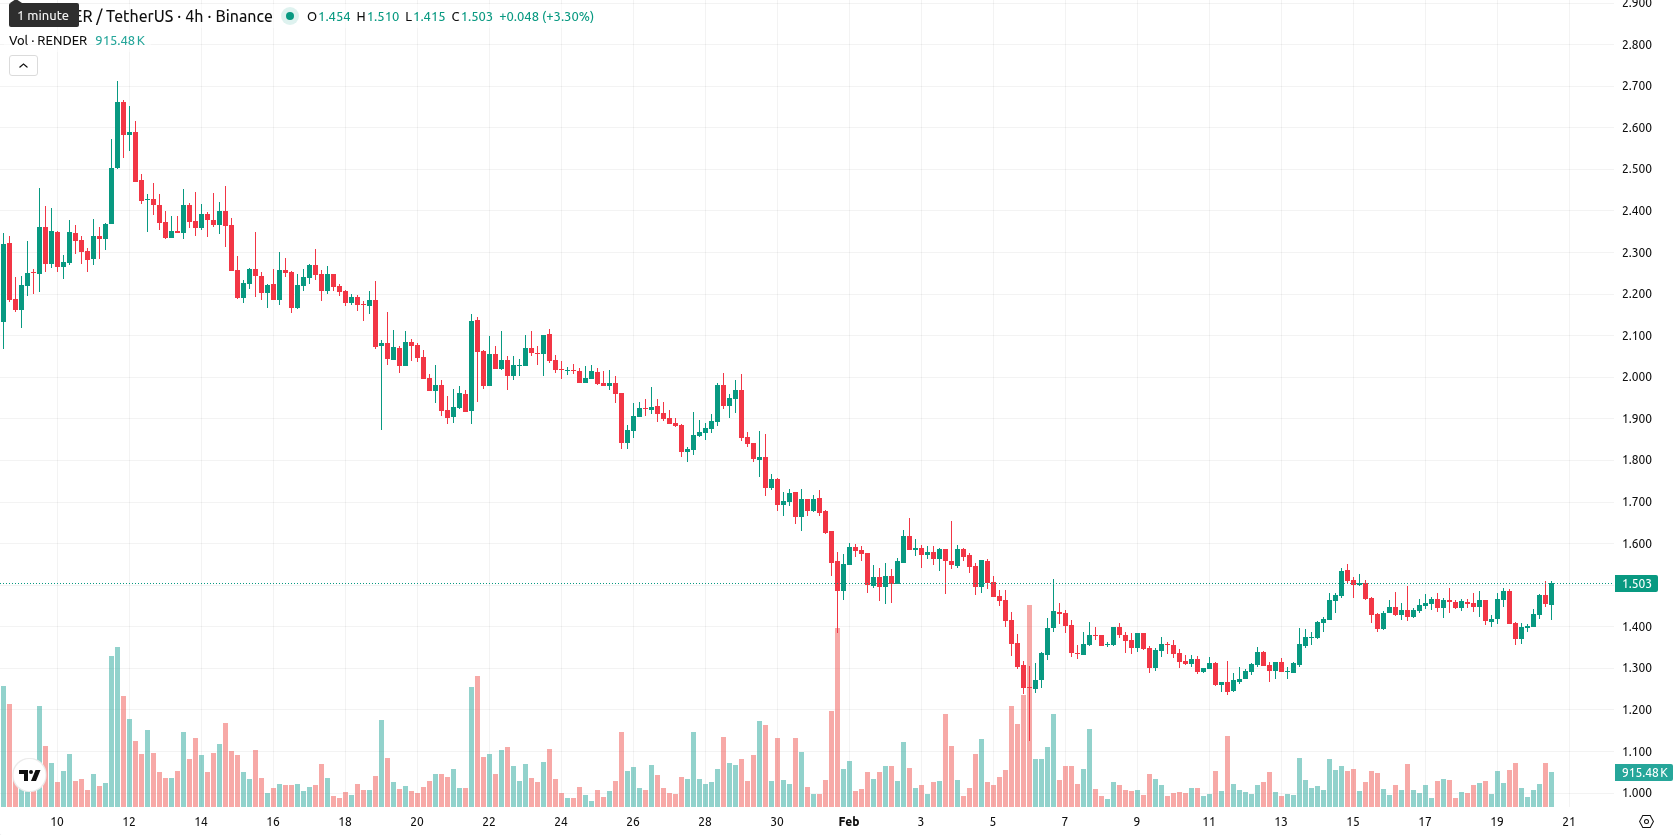
Intraday buying strength diverges from overall weak momentum signals
Assessment of momentum shows that both MACD and ADX on the daily timeframe signal a lack of upward strength, confirming bearish momentum overall. The RSI is subdued at 42 and suggests some ongoing bearishness, while Stochastic RSI and CCI are neutral, indicating that price is not currently overbought or oversold; Bull/Bear Power, however, tilts toward buyer dominance intraday. Daily price action shows a strong move up of 7.72% ($0.107) with no opening gap, closing near today’s high within a moderately wide range, indicating intraday strength toward the session’s upper end and suggesting increased volatility and aggressive buying after the open. Notably, there is a divergence between positive intraday momentum and the continued weak signals from major oscillators and momentum indicators.Downward bias likely as breakout faces resistance near volatility range
For the next five trading days, price action is expected in a typical volatility band between $1.30 and $1.65. There is a very low probability (less than 20%) of a sustained price increase, making a downward move more likely. The baseline scenario is for the price to move sideways between immediate resistance near $1.57 and support around recent lows. A bullish scenario would require a clear breakout and close above $1.57, while a breakdown below $1.30 would strengthen the prevailing bearish structure and could lead to further declines.
Viktoras Karapetjanc, expert at Traders Union, notes that Render is showing signs of a tactical recovery, yet the broader trend remains under pressure. He believes strengthening fundamentals, such as enhanced token utility and growing adoption in decentralized GPU compute, offer a solid backdrop for future gains. However, technical resistance at $1.57 must be cleared for sustained upside. Short-term volatility and weak broader momentum temper immediate bullish expectations. "Momentum could shift quickly if fundamentals continue improving and key resistance breaks — I am watching for a structural turnaround."
Recently, analysts observed that Render continues to exhibit sustained bearish momentum, with the asset trading below its major moving averages and momentum indicators such as RSI and MACD confirming a strong seller-controlled environment. The asset is expected to remain range-bound between established support at $1.30 and resistance near $1.60 over the coming week, with limited probability of a significant breakout.
Source of Data:
RENDER Price Analysis by TU
The analysis is based on a proprietary model combining technical, on-chain, and expert data. Not investment advice. See
methodology
The information is based on forecasts and does not constitute investment advice or a guarantee of future results. Market conditions may change. See our Disclaimer and Editorial Integrity for details.
Subscribe to TU news


Did you like the article?





Top News


Top 5 companies for you

United States
-
 Afghanistan
-
 Albania
-
 Algeria
-
 Angola
-
 Argentina
-
 Armenia
-
 Australia
-
 Austria
-
 Azerbaijan
-
 Bahamas
-
 Bahrain
-
 Bangladesh
-
 Belarus
-
 Belgium
-
 Bolivia
-
 Botswana
-
 Brazil
-
 Brunei
-
 Bulgaria
-
 Cambodia
-
 Cameroon
-
 Canada
-
 Chile
-
 China
-
 Colombia
-
 Congo
-
 Costa Rica
-
 Cote d'Ivoire
-
 Croatia
-
 Cuba
-
 Cyprus
-
 Czechia
-
 DR Congo
-
 Denmark
-
 Dominican Republic
-
 Ecuador
-
 Egypt
-
 El Salvador
-
 Estonia
-
 Eswatini
-
 Ethiopia
-
 Finland
-
 France
-
 Georgia
-
 Germany
-
 Ghana
-
 Greece
-
 Haiti
-
 Hong Kong
-
 Hungary
-
 India
-
 Indonesia
-
 Iran, Islamic republic
-
 Iraq
-
 Ireland
-
 Israel
-
 Italy
-
 Jamaica
-
 Japan
-
 Jordan
-
 Kazakhstan
-
 Kenya
-
 Korea
-
 Kuwait
-
 Kyrgyzstan
-
 Laos
-
 Latvia
-
 Lebanon
-
 Lesotho
-
 Libya
-
 Lithuania
-
 Luxembourg
-
 Madagascar
-
 Malaysia
-
 Malta
-
 Mauritius
-
 Mexico
-
 Moldova
-
 Mongolia
-
 Montenegro
-
 Morocco
-
 Mozambique
-
 Myanmar
-
 Namibia
-
 Nepal
-
 Netherlands
-
 New Zealand
-
 Nigeria
-
 North Macedonia
-
 Norway
-
 Oman
-
 Pakistan
-
 Palestine
-
 Panama
-
 Papua New Guinea
-
 Paraguay
-
 Peru
-
 Philippines
-
 Poland
-
 Portugal
-
 Puerto Rico
-
 Qatar
-
 Reunion
-
 Romania
-
 Rwanda
-
 Saudi Arabia
-
 Serbia
-
 Singapore
-
 Slovakia
-
 Slovenia
-
 Somalia
-
 South Africa
-
 Spain
-
 Sri Lanka
-
 Sweden
-
 Switzerland
-
 Syria
-
 Taiwan
-
 Tajikistan
-
 Tanzania
-
 Thailand
-
 Trinidad and Tobago
-
 Tunisia
-
 Turkey
-
 UAE
-
 Uganda
-
 Ukraine
-
 United Kingdom
-
United States
-
 Uruguay
-
 Uzbekistan
-
 Venezuela
-
 Vietnam
-
 Yemen
-
 Zambia
-
 Zimbabwe
- Forex
- Crypto










Live News


