
BNB maintains upward weekly momentum but technical indicators suggest limited upside and a likely bearish continuation – weekly review

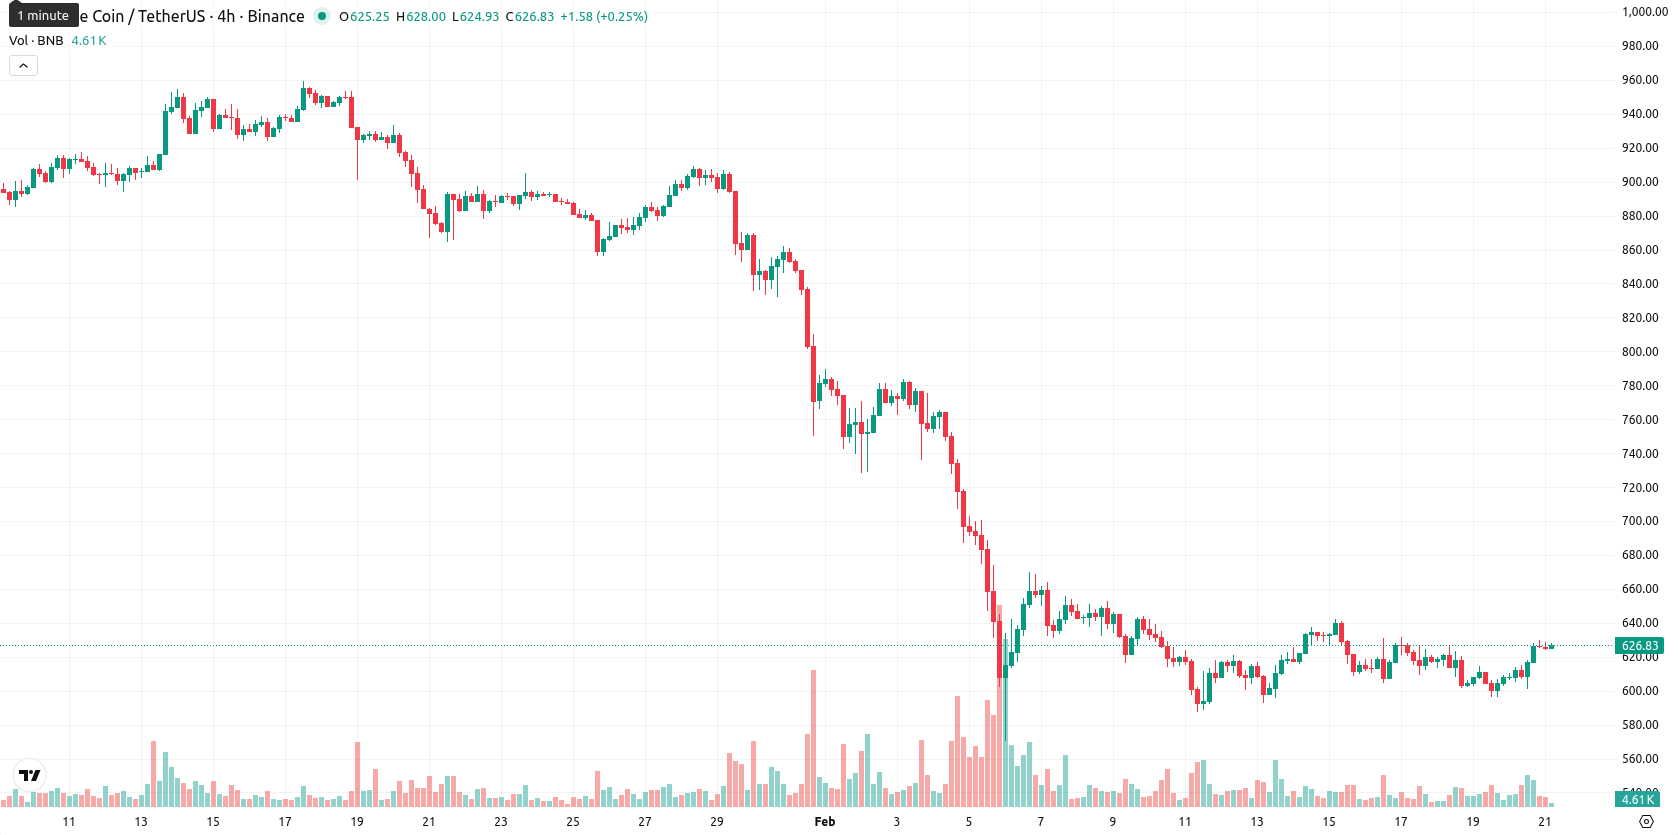
Binance Coin (BNB) trades at $626.90, reflecting a weekly movement near dynamic resistance after an upward gap from the previous close at $612.70. Over the past week, BNB has remained below its key weekly moving averages — MA-20 at $648.30, MA-50 at $798.20, and MA-200 at $909.50 — highlighting sustained downward pressure from sellers.
Highlights
- BNB is trading at $626.90, below its MA-20 ($648.30), MA-50 ($798.20), and MA-200 ($909.50), indicating sustained pressure from sellers across all timeframes.
- Momentum is firmly negative, with MACD and ADX signaling a strong bearish trend and RSI near 35, while intraday price action diverges with moderate volatility.
- BNB faces immediate resistance at $650 (MA-50) and support at $590, with a high probability of sideways consolidation and further downside risk dominating the next five days.
Bearish momentum persists as key technical levels cap gains over the week
On the weekly chart, BNB remains below important W1 moving averages — MA-20 at $648.30, MA-50 at $798.20, and MA-200 at $909.50 — indicating strong bearish sentiment across short-, medium-, and long-term timeframes. The nearest resistance levels are at the MA-50 ($650) and the Ichimoku Kijun ($739.80), while support is anchored near $590. Weekly RSI sits near 35, underscoring a bearish zone, while other indicators such as MACD, ADX, and Bull/Bear Power continue to signal persistent seller control.
Sideways consolidation likely as upside momentum remains limited next week
For the next five to seven trading days, BNB’s price is expected to remain in a range between $590 and $650, with a low probability of upward movement (below 20%). A sideways consolidation scenario is favored given prevailing momentum and technical indicators. If bulls manage to break above $650, the asset could test higher resistances around the Ichimoku Kijun, but a move below $590 would increase downside risks, with the technical setup favoring bearish continuation in the short term.
Last time, analysts noted that Binance Coin traded lower on persistent selling pressure, with its price drifting toward session lows and reflecting heightened volatility. Technical indicators highlight broad weakness as BNB remains well below key moving averages, faces resistance near the Ichimoku Kijun, and shows bearish momentum with an oversold RSI, while consolidation between $575 and $635 is anticipated short term.


Latest BNB News


-
 Afghanistan
-
 Albania
-
 Algeria
-
 Angola
-
 Argentina
-
 Armenia
-
 Australia
-
 Austria
-
 Azerbaijan
-
 Bahamas
-
 Bahrain
-
 Bangladesh
-
 Belarus
-
 Belgium
-
 Bolivia
-
 Botswana
-
 Brazil
-
 Brunei
-
 Bulgaria
-
 Cambodia
-
 Cameroon
-
 Canada
-
 Chile
Chile
-
 China
China
-
 Colombia
-
 Congo
Congo
-
 Costa Rica
-
 Cote d'Ivoire
-
 Croatia
-
 Cuba
Cuba
-
 Cyprus
-
 Czechia
-
 DR Congo
-
 Denmark
-
 Dominican Republic
-
 Ecuador
-
 Egypt
Egypt
-
 El Salvador
-
 Estonia
-
 Eswatini
-
 Ethiopia
-
 Finland
-
 France
-
 Georgia
-
 Germany
-
 Ghana
Ghana
-
 Greece
-
 Haiti
Haiti
-
 Hong Kong
-
 Hungary
-
 India
India
-
 Indonesia
-
 Iran, Islamic republic
-
 Iraq
Iraq
-
 Ireland
-
 Israel
-
 Italy
Italy
-
 Jamaica
-
 Japan
Japan
-
 Jordan
-
 Kazakhstan
-
 Kenya
Kenya
-
 Korea
Korea
-
 Kuwait
-
 Kyrgyzstan
-
 Laos
Laos
-
 Latvia
-
 Lebanon
-
 Lesotho
-
 Libya
Libya
-
 Lithuania
-
 Luxembourg
-
 Madagascar
-
 Malaysia
-
 Malta
Malta
-
 Mauritius
-
 Mexico
-
 Moldova
-
 Mongolia
-
 Montenegro
-
 Morocco
-
 Mozambique
-
 Myanmar
-
 Namibia
-
 Nepal
Nepal
-
 Netherlands
-
 New Zealand
-
 Nigeria
-
 North Macedonia
-
 Norway
-
 Oman
Oman
-
 Pakistan
-
 Palestine
-
 Panama
-
 Papua New Guinea
-
 Paraguay
-
 Peru
Peru
-
 Philippines
-
 Poland
-
 Portugal
-
 Puerto Rico
-
 Qatar
Qatar
-
 Reunion
-
 Romania
-
 Rwanda
-
 Saudi Arabia
-
 Serbia
-
 Singapore
-
 Slovakia
-
 Slovenia
-
 Somalia
-
 South Africa
-
 Spain
Spain
-
 Sri Lanka
-
 Sweden
-
 Switzerland
-
 Syria
Syria
-
 Taiwan
-
 Tajikistan
-
 Tanzania
-
 Thailand
-
 Trinidad and Tobago
-
 Tunisia
-
 Turkey
-
 UAE
UAE
-
 Uganda
-
 Ukraine
-
 United Kingdom
-
United States
-
 Uruguay
-
 Uzbekistan
-
 Venezuela
-
 Vietnam
-
 Yemen
Yemen
-
 Zambia
-
 Zimbabwe
- Forex
- Crypto
