
Tron up 2.92% as new cross-chain capabilities and treasury accumulation counter risks of near-term price pullback – weekly review

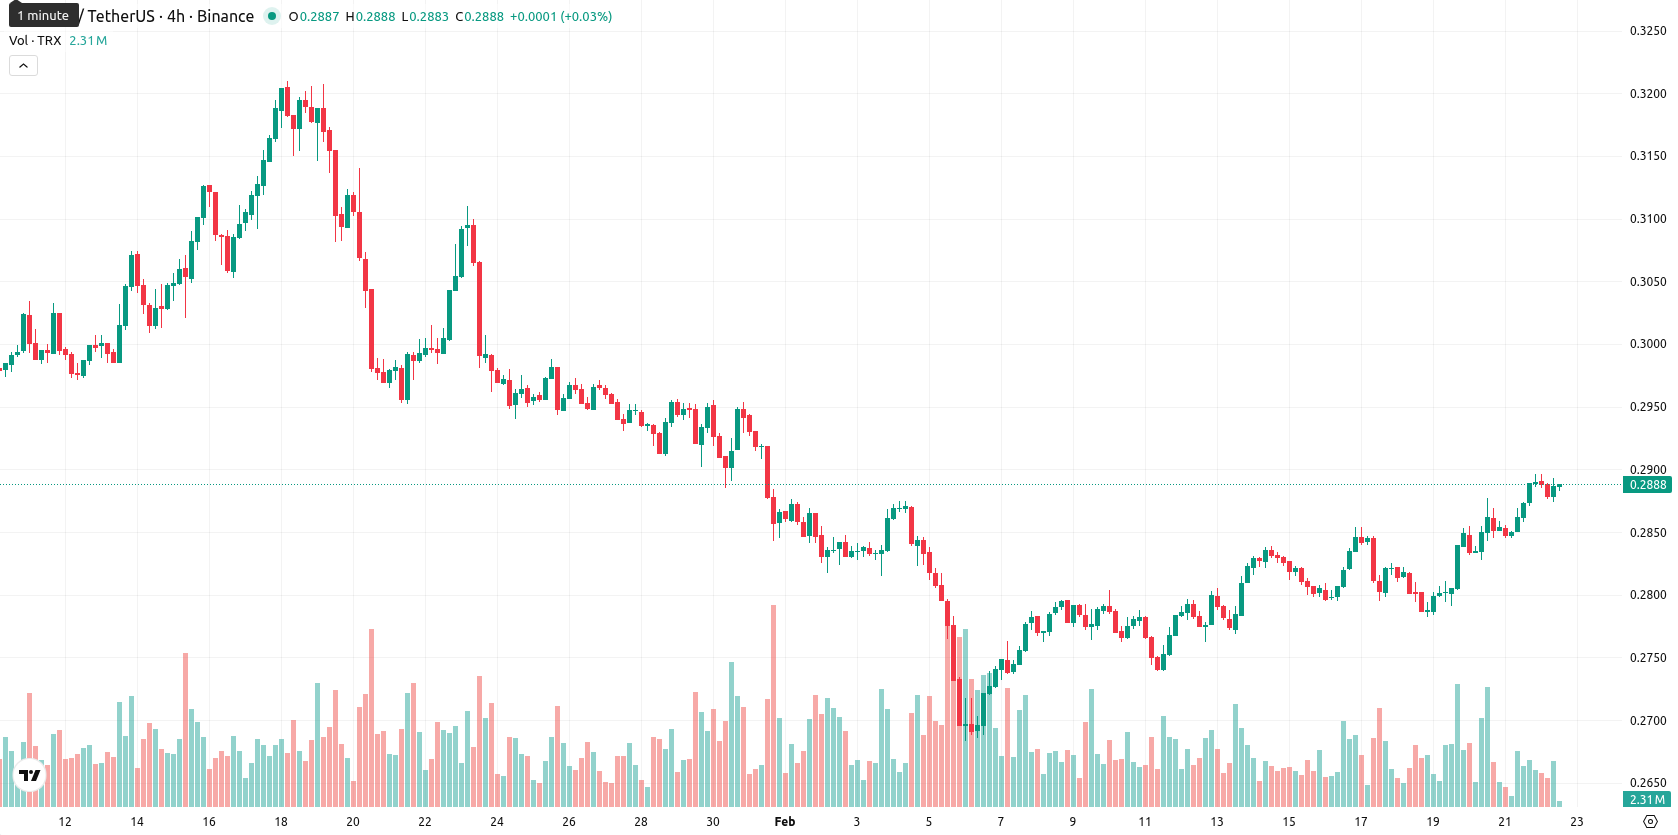
Tron (TRX) closed the week at $0.2888, posting a modest gain within the last 7 days. The asset is trading above its MA-20 ($0.2809) and Ichimoku Kijun ($0.2825), but remains just below its MA-50 ($0.2922) and well under the long-term MA-200 ($0.3082), reflecting short- and medium-term bullish momentum while the long-term trend is not yet reversed.
Highlights
- TRX is trading at $0.2888, above its MA-20 ($0.2809) and Ichimoku Kijun ($0.2825), but below MA-50 ($0.2922) and MA-200 ($0.3082), signaling short-term bullish momentum amid a bearish long-term trend.
- Mixed momentum signals include a daily MACD strong sell, Stochastic RSI and CCI overbought readings, neutral ADX daily trend, and bullish ADX on the weekly chart.
- Expected price range for the week is $0.2850 to $0.2925 with less than 20% probability of a breakout; baseline scenario anticipates sideways consolidation.
Ecosystem expansion and treasury growth drive positive sentiment this week
Tron expanded its interoperability and DeFi reach by integrating with Coinbase's Base layer-2 via LayerZero, enabling cross-chain TRX bridging and underscoring its continued leadership in stablecoins and low-fee transactions. The network further strengthened its position as Tron Inc. increased its treasury holdings with the recent acquisition of 177,587 TRX, raising the total above 682 million TRX. Growth in on-chain USDT payment volumes and participation at ETHDenver 2026 highlighted rising developer engagement and ecosystem innovation.
Mixed technical signals fuel uncertainty despite bullish weekly momentum
On the weekly timeframe, TRX trades above its MA-20 and Ichimoku Kijun, signaling short-term bullish momentum, but stays just below the MA-50 resistance at $0.2922 and well below the MA-200 at $0.3082. Weekly support is seen near the Ichimoku Kijun at $0.2825, and weekly resistance is focused at $0.2922. Weekly technical indicators show a mixed picture — bullish price action is countered by overbought signals from the Stochastic RSI and Commodity Channel Index, while the RSI indicates buyers still have control but may soon slow. The weekly ADX is bullish, but momentum signals remain divergent and add to near-term uncertainty.
Sideways trading expected as mixed signals limit breakout risks next week
Looking to the next 5–7 trading days, a sideways consolidation between $0.2850 and $0.2925 appears most likely as mixed weekly signals weigh on further upside. The probability of a price increase beyond current levels is low (less than 20%), with weekly trends suggesting greater risk of a pullback or stagnation. A bullish breakout above $0.2925 could trigger a test of higher resistance, but a drop below $0.2850 would expose support near $0.2825.
Last time, analysts noted that Tron is trading just above its 20-day moving average but remains below the 50- and 200-day levels, with mixed momentum indicated by a neutral RSI and persistent selling pressure on the MACD. Immediate support is seen at the Ichimoku Kijun, while resistance lies at the 50-day moving average, suggesting a likely sideways trend with limited upside potential in the short term.


-
 Afghanistan
-
 Albania
-
 Algeria
-
 Angola
-
 Argentina
-
 Armenia
-
 Australia
-
 Austria
-
 Azerbaijan
-
 Bahamas
-
 Bahrain
-
 Bangladesh
-
 Belarus
-
 Belgium
-
 Bolivia
-
 Botswana
-
 Brazil
-
 Brunei
-
 Bulgaria
-
 Cambodia
-
 Cameroon
-
 Canada
-
 Chile
Chile
-
 China
China
-
 Colombia
-
 Congo
Congo
-
 Costa Rica
-
 Cote d'Ivoire
-
 Croatia
-
 Cuba
Cuba
-
 Cyprus
-
 Czechia
-
 DR Congo
-
 Denmark
-
 Dominican Republic
-
 Ecuador
-
 Egypt
Egypt
-
 El Salvador
-
 Estonia
-
 Eswatini
-
 Ethiopia
-
 Finland
-
 France
-
 Georgia
-
 Germany
-
 Ghana
Ghana
-
 Greece
-
 Haiti
Haiti
-
 Hong Kong
-
 Hungary
-
 India
India
-
 Indonesia
-
 Iran, Islamic republic
-
 Iraq
Iraq
-
 Ireland
-
 Israel
-
 Italy
Italy
-
 Jamaica
-
 Japan
Japan
-
 Jordan
-
 Kazakhstan
-
 Kenya
Kenya
-
 Korea
Korea
-
 Kuwait
-
 Kyrgyzstan
-
 Laos
Laos
-
 Latvia
-
 Lebanon
-
 Lesotho
-
 Libya
Libya
-
 Lithuania
-
 Luxembourg
-
 Madagascar
-
 Malaysia
-
 Malta
Malta
-
 Mauritius
-
 Mexico
-
 Moldova
-
 Mongolia
-
 Montenegro
-
 Morocco
-
 Mozambique
-
 Myanmar
-
 Namibia
-
 Nepal
Nepal
-
 Netherlands
-
 New Zealand
-
 Nigeria
-
 North Macedonia
-
 Norway
-
 Oman
Oman
-
 Pakistan
-
 Palestine
-
 Panama
-
 Papua New Guinea
-
 Paraguay
-
 Peru
Peru
-
 Philippines
-
 Poland
-
 Portugal
-
 Puerto Rico
-
 Qatar
Qatar
-
 Reunion
-
 Romania
-
 Rwanda
-
 Saudi Arabia
-
 Serbia
-
 Singapore
-
 Slovakia
-
 Slovenia
-
 Somalia
-
 South Africa
-
 Spain
Spain
-
 Sri Lanka
-
 Sweden
-
 Switzerland
-
 Syria
Syria
-
 Taiwan
-
 Tajikistan
-
 Tanzania
-
 Thailand
-
 Trinidad and Tobago
-
 Tunisia
-
 Turkey
-
 UAE
UAE
-
 Uganda
-
 Ukraine
-
 United Kingdom
-
United States
-
 Uruguay
-
 Uzbekistan
-
 Venezuela
-
 Vietnam
-
 Yemen
Yemen
-
 Zambia
-
 Zimbabwe
- Forex
- Crypto
