
Deflationary token burns and rising fees — Polygon slips 7.05%

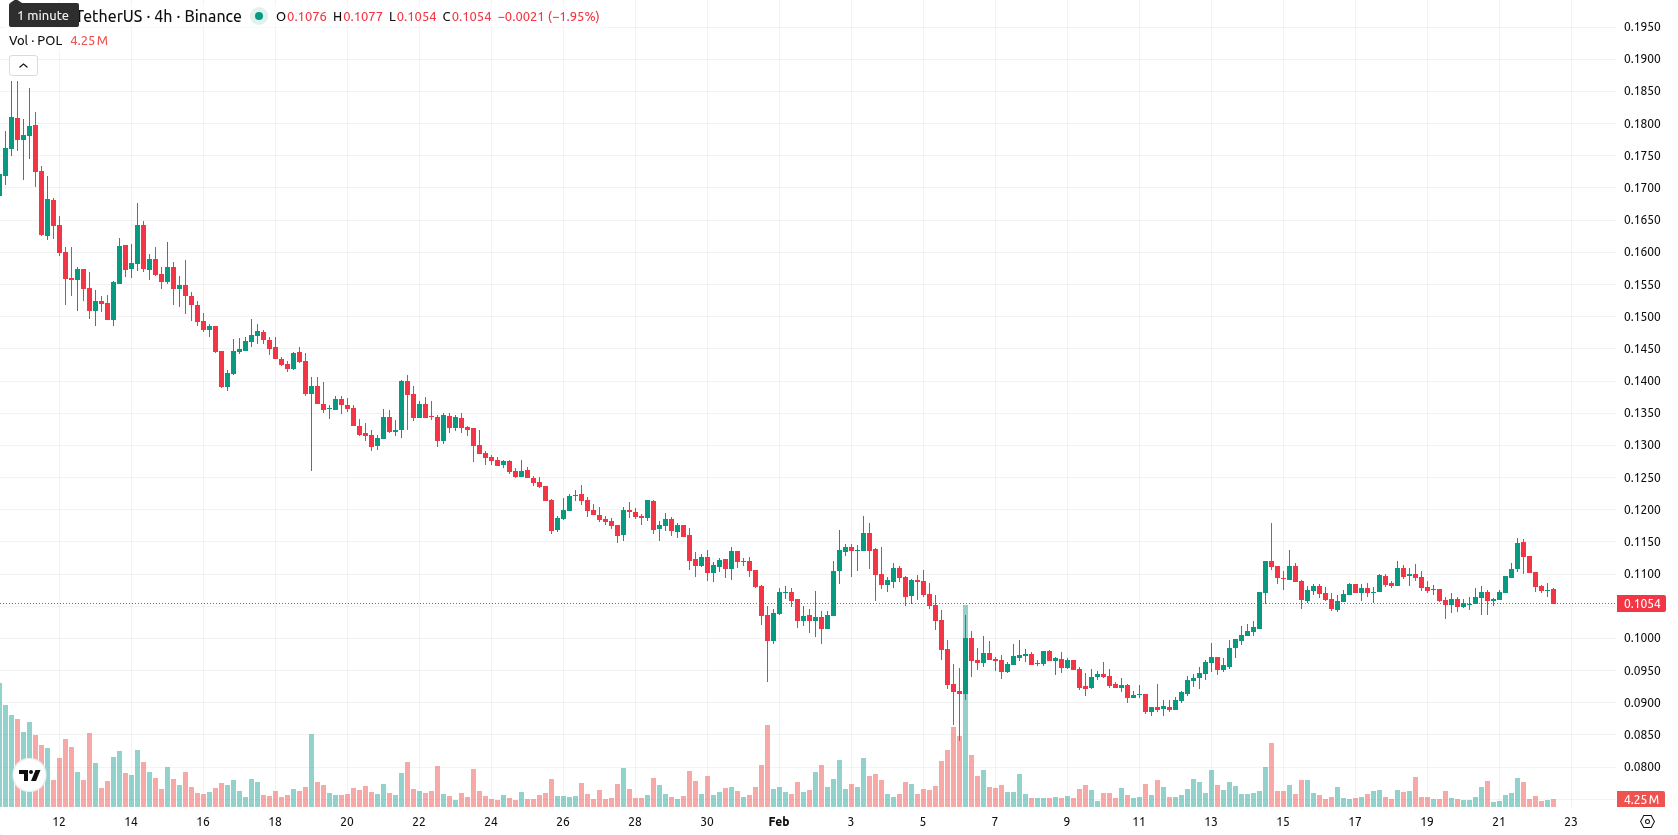
Polygon (POL, formerly MATIC) is trading at $0.1055, showing a daily decline of 7.05%. The asset currently sits just above the MA-20 ($0.1023), well below the MA-50 ($0.1207) and the MA-200 ($0.1745), indicating persistent short-term volatility and sustained downside momentum relative to its key moving averages.
Highlights
- Polygon has burned over 100 million POL tokens, reinforcing its deflationary approach amid accelerating institutional adoption and expanding enterprise partnerships.
- Franklin Templeton has integrated POL into a tokenized fund, while cross-border payments for the 2026 Winter Olympics and partnerships with Disney and Starbucks highlight broadening real-world utility.
- POL is trading at $0.1055, showing short-term stabilization above $0.1027 support, but strong bearish momentum and high short positioning indicate downside risk if support fails.
Deflationary token burns and stable open interest amid rising shorts
Over 100 million POL tokens have been burned as part of recent network activity, highlighting continued deflationary action on the Polygon platform. Institutional adoption has accelerated, with Franklin Templeton integrating POL into a tokenized fund and new use cases emerging, including cross-border payments for the 2026 Winter Olympics. Ongoing enterprise partnerships with companies like Disney and Starbucks further support ecosystem growth, while daily protocol fees have surpassed $500,000, reflecting strong network utility. Open interest has remained stable, but elevated short positioning continues to threaten key support levels.
Intraday selling pressure persists as oscillators diverge across timeframes
Momentum indicators reveal mixed signals: the MACD signals strong bearish momentum, while the ADX is modest and technically supportive of a potential trend. The RSI and CCI are both in buy territory without signaling overbought or oversold extremes, but the Stochastic RSI is at maximum (overbought) while shorter timeframes show persistent oversold readings, indicating divergence between timeframes and momentum oscillators. Bull/Bear Power points to mild buyer dominance but is weak, the daily price is down 7.05% with no appreciable gap at the open, and the current price sits at the low end of today's range, reflecting high intraday volatility and clear selling pressure after the open; these factors collectively confirm intraday downside momentum dominating despite some higher timeframe oscillators flashing potential for a technical rebound.
Downside bias expected as volatility bands limit rebound odds
Looking ahead, the expected price range for the next five trading days is between $0.095 and $0.118, representing a volatility band relative to current levels given the recent high fluctuations. There is a very low probability (less than 20%) of a price increase, making further decreases the more likely scenario. Baseline expectations are for the price to move sideways within this corridor; any short-term bullish move would require a sustained break above immediate support and the MA-50, while a daily close below $0.102 could trigger additional downside risk.
Last time, analysts noted that Polygon (POL) is displaying short-term bullish momentum while remaining constrained by medium- and long-term bearish signals, with price currently sitting above the MA-20 but below both the MA-50 and MA-200. Despite strong intraday buying pressure, momentum indicators such as the MACD and RSI remain bearish, suggesting limited upside and an increased likelihood of consolidation or downside risk unless resistance above $0.116 is breached.


-
 Afghanistan
-
 Albania
-
 Algeria
-
 Angola
-
 Argentina
-
 Armenia
-
 Australia
-
 Austria
-
 Azerbaijan
-
 Bahamas
-
 Bahrain
-
 Bangladesh
-
 Belarus
-
 Belgium
-
 Bolivia
-
 Botswana
-
 Brazil
-
 Brunei
-
 Bulgaria
-
 Cambodia
-
 Cameroon
-
 Canada
-
 Chile
Chile
-
 China
China
-
 Colombia
-
 Congo
Congo
-
 Costa Rica
-
 Cote d'Ivoire
-
 Croatia
-
 Cuba
Cuba
-
 Cyprus
-
 Czechia
-
 DR Congo
-
 Denmark
-
 Dominican Republic
-
 Ecuador
-
 Egypt
Egypt
-
 El Salvador
-
 Estonia
-
 Eswatini
-
 Ethiopia
-
 Finland
-
 France
-
 Georgia
-
 Germany
-
 Ghana
Ghana
-
 Greece
-
 Haiti
Haiti
-
 Hong Kong
-
 Hungary
-
 India
India
-
 Indonesia
-
 Iran, Islamic republic
-
 Iraq
Iraq
-
 Ireland
-
 Israel
-
 Italy
Italy
-
 Jamaica
-
 Japan
Japan
-
 Jordan
-
 Kazakhstan
-
 Kenya
Kenya
-
 Korea
Korea
-
 Kuwait
-
 Kyrgyzstan
-
 Laos
Laos
-
 Latvia
-
 Lebanon
-
 Lesotho
-
 Libya
Libya
-
 Lithuania
-
 Luxembourg
-
 Madagascar
-
 Malaysia
-
 Malta
Malta
-
 Mauritius
-
 Mexico
-
 Moldova
-
 Mongolia
-
 Montenegro
-
 Morocco
-
 Mozambique
-
 Myanmar
-
 Namibia
-
 Nepal
Nepal
-
 Netherlands
-
 New Zealand
-
 Nigeria
-
 North Macedonia
-
 Norway
-
 Oman
Oman
-
 Pakistan
-
 Palestine
-
 Panama
-
 Papua New Guinea
-
 Paraguay
-
 Peru
Peru
-
 Philippines
-
 Poland
-
 Portugal
-
 Puerto Rico
-
 Qatar
Qatar
-
 Reunion
-
 Romania
-
 Rwanda
-
 Saudi Arabia
-
 Serbia
-
 Singapore
-
 Slovakia
-
 Slovenia
-
 Somalia
-
 South Africa
-
 Spain
Spain
-
 Sri Lanka
-
 Sweden
-
 Switzerland
-
 Syria
Syria
-
 Taiwan
-
 Tajikistan
-
 Tanzania
-
 Thailand
-
 Trinidad and Tobago
-
 Tunisia
-
 Turkey
-
 UAE
UAE
-
 Uganda
-
 Ukraine
-
 United Kingdom
-
United States
-
 Uruguay
-
 Uzbekistan
-
 Venezuela
-
 Vietnam
-
 Yemen
Yemen
-
 Zambia
-
 Zimbabwe
- Forex
- Crypto
