
Polygon edges higher as strong volatility widens seven-day trading range: weekly analysis

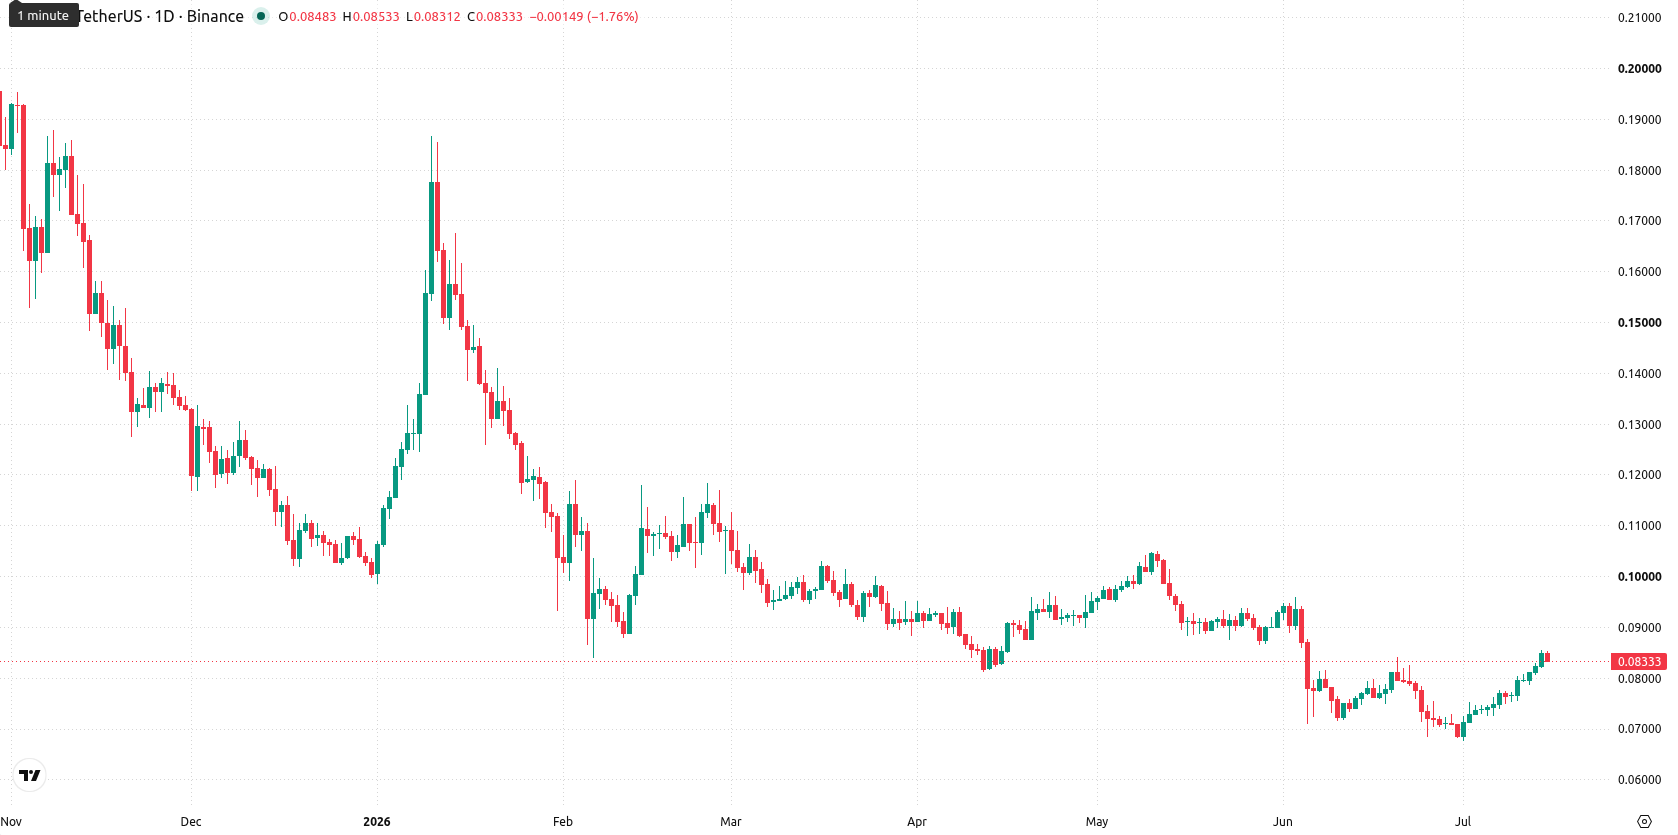
Polygon (POL, formerly MATIC) is trading at $0.0834, having gained $0.0077 (10.03%) over the past week. The asset remains below its weekly MA-20 of $0.0875 and MA-50 at $0.1385, signaling ongoing selling pressure and lack of sustained bullish momentum, with the MA-20 now acting as dynamic resistance.
 0.0853
0.0855
0.0853
0.0855
Highlights
- POL trades below key moving averages, with technical pressure reflecting a lack of sustained bullish activity.
- Momentum remains decisively bearish, as multiple indicators register sell signals and directional conviction is weak.
- Expect consolidation between $0.0750 support and $0.0925 resistance, with a downward or sideways trend favored over upside breakout.
Bearish momentum persists despite price recovery over the week
Technical analysis on the weekly timeframe shows all momentum indicators firmly bearish for POL. The MACD and ADX both point to a sell bias, while the RSI is weak at 41.81, and Stochastic RSI flags overbought conditions. The CCI is neutral, indicating limited directional conviction, and Bull/Bear Power slightly favors buyers but not enough to offset the prevailing weakness. POL’s weekly volatility is robust at 13.55%, placing it in the upper part of the recent range, but the divergence between price recovery and bearish momentum highlights uncertainty.
Sideways or lower outlook as breakout risks remain limited next week
Over the next 7 days, POL is expected to trade between $0.0750 and $0.0925, reflecting typical weekly volatility. Based on weekly indicators, the likelihood of further gains is very low (less than 20%), as none of the four primary signals suggest a buy setup. The baseline scenario favors sideways activity or a moderate decline, with consolidation likely between support at $0.0750 and resistance around $0.0925. If bullish momentum unexpectedly returns and triggers a breakout above $0.0925, a move towards the MA-20 could follow, while slipping below $0.0750 would risk retesting long-term lows.
Earlier, analysts noted a sustained bearish trend for Polygon citing persistent selling pressure and weak technical momentum. The current analysis reinforces this cautious outlook, highlighting that unless a clear bullish reversal emerges, traders should focus on the $0.0750 support as a critical risk level in the coming week.








-
 Afghanistan
-
 Albania
-
 Algeria
-
 Angola
-
 Argentina
-
 Armenia
-
 Australia
-
 Austria
-
 Azerbaijan
-
 Bahamas
-
 Bahrain
-
 Bangladesh
-
 Belarus
-
 Belgium
-
 Bolivia
-
 Botswana
-
 Brazil
-
 Brunei
-
 Bulgaria
-
 Cambodia
-
 Cameroon
-
 Canada
-
 Chile
Chile
-
 China
China
-
 Colombia
-
 Congo
Congo
-
 Costa Rica
-
 Cote d'Ivoire
-
 Croatia
-
 Cuba
Cuba
-
 Cyprus
-
 Czechia
-
 DR Congo
-
 Denmark
-
 Dominican Republic
-
 Ecuador
-
 Egypt
Egypt
-
 El Salvador
-
 Estonia
-
 Eswatini
-
 Ethiopia
-
 Finland
-
 France
-
 Georgia
-
 Germany
-
 Ghana
Ghana
-
 Greece
-
 Haiti
Haiti
-
 Hong Kong
-
 Hungary
-
 India
India
-
 Indonesia
-
 Iran, Islamic republic
-
 Iraq
Iraq
-
 Ireland
-
 Israel
-
 Italy
Italy
-
 Jamaica
-
 Japan
Japan
-
 Jordan
-
 Kazakhstan
-
 Kenya
Kenya
-
 Korea
Korea
-
 Kuwait
-
 Kyrgyzstan
-
 Laos
Laos
-
 Latvia
-
 Lebanon
-
 Lesotho
-
 Libya
Libya
-
 Lithuania
-
 Luxembourg
-
 Madagascar
-
 Malaysia
-
 Malta
Malta
-
 Mauritius
-
 Mexico
-
 Moldova
-
 Mongolia
-
 Montenegro
-
 Morocco
-
 Mozambique
-
 Myanmar
-
 Namibia
-
 Nepal
Nepal
-
 Netherlands
-
 New Zealand
-
 Nigeria
-
 North Macedonia
-
 Norway
-
 Oman
Oman
-
 Pakistan
-
 Palestine
-
 Panama
-
 Papua New Guinea
-
 Paraguay
-
 Peru
Peru
-
 Philippines
-
 Poland
-
 Portugal
-
 Puerto Rico
-
 Qatar
Qatar
-
 Reunion
-
 Romania
-
 Rwanda
-
 Saudi Arabia
-
 Serbia
-
 Singapore
-
 Slovakia
-
 Slovenia
-
 Somalia
-
 South Africa
-
 Spain
Spain
-
 Sri Lanka
-
 Sweden
-
 Switzerland
-
 Syria
Syria
-
 Taiwan
-
 Tajikistan
-
 Tanzania
-
 Thailand
-
 Trinidad and Tobago
-
 Tunisia
-
 Turkey
-
 UAE
UAE
-
 Uganda
-
 Ukraine
-
 United Kingdom
-
United States
-
 Uruguay
-
 Uzbekistan
-
 Venezuela
-
 Vietnam
-
 Yemen
Yemen
-
 Zambia
-
 Zimbabwe
- Forex
- Crypto











