

-7.05% for Render — Bearish momentum continues amid governance participation

Render (RENDER) is trading at $1.411 after falling 7.05% today. The price is positioned just above the MA-20 ($1.4025), but remains well below both the MA-50 ($1.7482) and MA-200 ($2.4159), reflecting weak near-term support and ongoing medium- and long-term bearish momentum.
RENDER price prediction
Current price:
$1.235
-0.087
6.58%
Real-time Data
12:13
Daily range
1.19
 1.286
1.286
Weekly range
1.2310
1.4960
1.4960
Loading...
Highlights
- The Render Network introduced tokenomic features that reduce token supply as more computing jobs are processed, supporting long-term fundamentals.
- Render holders engaged in protocol governance, guiding network upgrades while the asset remains exposed to broader AI, crypto infrastructure shifts, and regional regulatory uncertainty.
- RENDER trades at $1.411, below key moving averages and immediate Kijun resistance at $1.4255, with technicals indicating bearish momentum and likely further downside within a $1.130–$1.690 range.
Ecosystem growth offsets supply cuts amid regulatory and macro pressures
The Render Network recorded continued usage and added tokenomic features that decrease token supply as additional computing jobs were processed. Render holders participated in protocol governance, shaping network upgrades and project direction. The asset remains closely linked to broader AI and crypto infrastructure developments, with possible sensitivity to regulatory uncertainty in some regions, though price action has remained under broader selling pressure.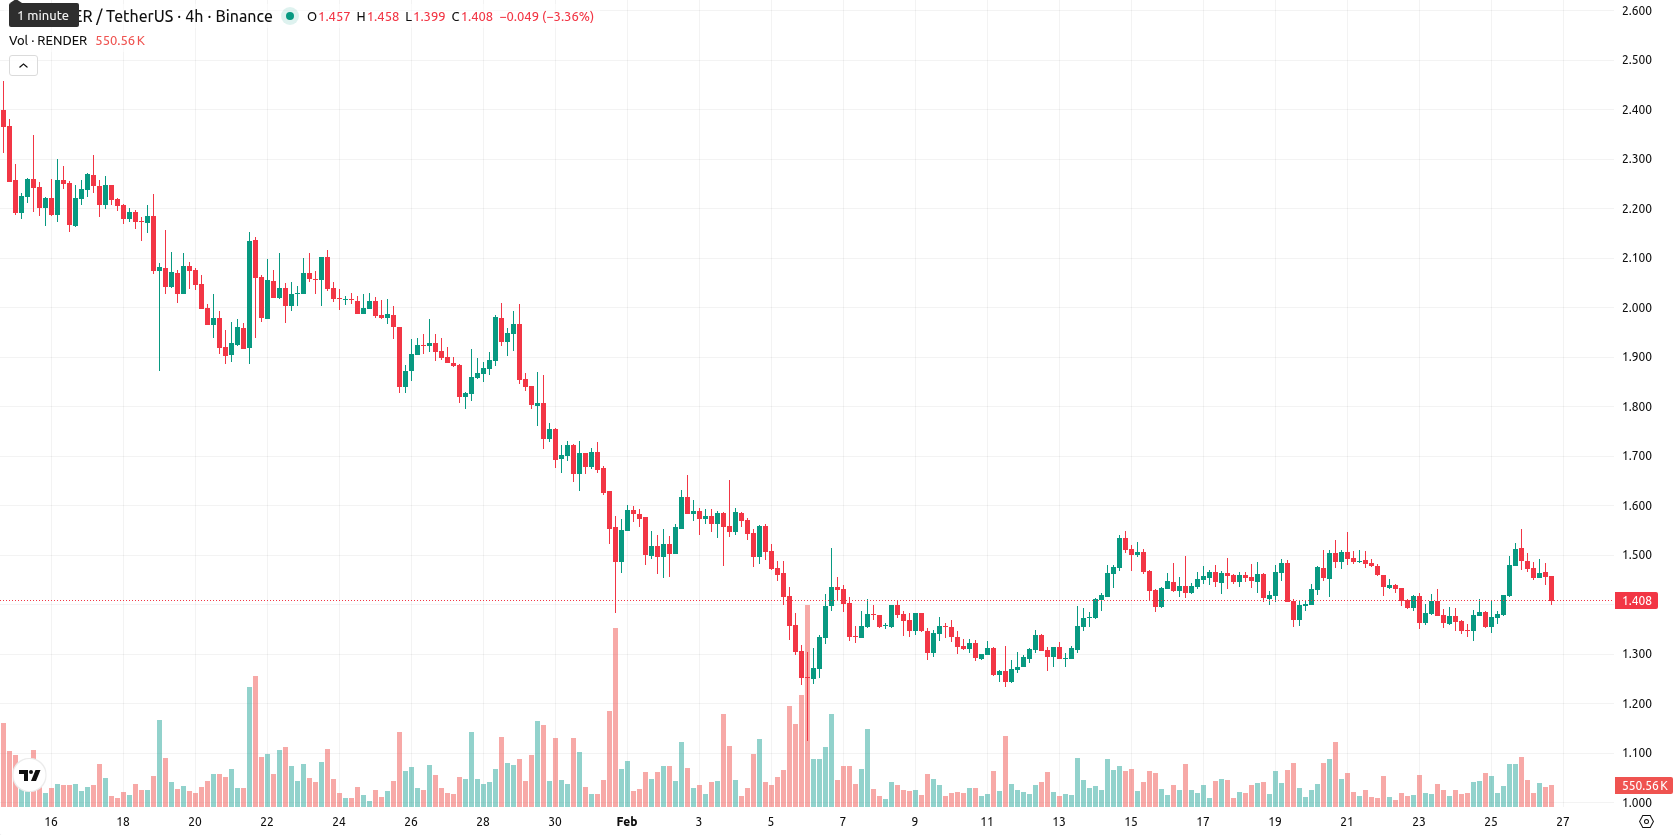
Bearish momentum intensifies as resistance levels and indicators align
The current price of RENDER at $1.411 trades just above the MA-20 ($1.4025), but is well below the MA-50 ($1.7482) and MA-200 ($2.4159), indicating weak short-term support, ongoing medium-term seller pressure, and a sustained long-term bearish structure. The Ichimoku Kijun level at $1.4255 sits above the current price, marking immediate resistance. MACD signals strong downward momentum, confirmed by ADX readings that also point to a sell bias. RSI levels on both the daily (49.91) and weekly (39.55) timeframes align with selling pressure, while the Stochastic RSI is flagged as overbought—contradicting the bearish momentum and highlighting a divergence. Bull/Bear Power appears positive on the day, hinting at pockets of buyer activity, yet the Awesome Oscillator remains neutral and does not affirm a clear trend. The price opened slightly below the previous close, showing no significant gap, and is now near the low end of today's range after slipping 7.05%, with high intraday volatility and continued downward pressure following the open.Downside risk prevails as low rebound odds meet volatility band
For the coming week, RENDER is expected to trade within a $1.130 to $1.690 range, which represents a volatility band relative to current levels. The likelihood of a sustained price increase is very low (less than 20%), and further declines are considered more probable. The baseline outlook calls for continued sideways movement between noted support and resistance. A move above the $1.43 resistance would be needed to change the upside scenario, but a break below $1.13 would suggest potential for deeper declines.
Anton Kharitonov, expert at Traders Union, views RENDER’s technical structure as decisively bearish while acknowledging ongoing but limited protocol-level activity and governance participation. He notes that selling pressure remains dominant, with short- and long-term momentum indicators signaling little prospect of a recovery unless key resistance levels are reclaimed. In his opinion, sideways movement is the base case, but risks are skewed to the downside due to weak support and continued volatility. "Until RENDER can firmly break above $1.43, I remain cautious and expect further downside risk."
Previously it was reported that Render is exhibiting short-term upside above its 20-day moving average but remains below key medium- and long-term averages, signaling ongoing broader bearish pressure. Despite a volatile intraday rebound nearing resistance at the MA-50, mixed momentum indicators and prevailing daily bearish signals suggest caution as sellers retain a slight advantage.
Source of Data:
RENDER Price Analysis by TU
The analysis is based on a proprietary model combining technical, on-chain, and expert data. Not investment advice. See
methodology
The information is based on forecasts and does not constitute investment advice or a guarantee of future results. Market conditions may change. See our Disclaimer and Editorial Integrity for details.
Subscribe to TU news


Did you like the article?






Top News


Top 5 companies for you

United States
-
 Afghanistan
-
 Albania
-
 Algeria
-
 Angola
-
 Argentina
-
 Armenia
-
 Australia
-
 Austria
-
 Azerbaijan
-
 Bahamas
-
 Bahrain
-
 Bangladesh
-
 Belarus
-
 Belgium
-
 Bolivia
-
 Botswana
-
 Brazil
-
 Brunei
-
 Bulgaria
-
 Cambodia
-
 Cameroon
-
 Canada
-
 Chile
-
 China
-
 Colombia
-
 Congo
-
 Costa Rica
-
 Cote d'Ivoire
-
 Croatia
-
 Cuba
-
 Cyprus
-
 Czechia
-
 DR Congo
-
 Denmark
-
 Dominican Republic
-
 Ecuador
-
 Egypt
-
 El Salvador
-
 Estonia
-
 Eswatini
-
 Ethiopia
-
 Finland
-
 France
-
 Georgia
-
 Germany
-
 Ghana
-
 Greece
-
 Haiti
-
 Hong Kong
-
 Hungary
-
 India
-
 Indonesia
-
 Iran, Islamic republic
-
 Iraq
-
 Ireland
-
 Israel
-
 Italy
-
 Jamaica
-
 Japan
-
 Jordan
-
 Kazakhstan
-
 Kenya
-
 Korea
-
 Kuwait
-
 Kyrgyzstan
-
 Laos
-
 Latvia
-
 Lebanon
-
 Lesotho
-
 Libya
-
 Lithuania
-
 Luxembourg
-
 Madagascar
-
 Malaysia
-
 Malta
-
 Mauritius
-
 Mexico
-
 Moldova
-
 Mongolia
-
 Montenegro
-
 Morocco
-
 Mozambique
-
 Myanmar
-
 Namibia
-
 Nepal
-
 Netherlands
-
 New Zealand
-
 Nigeria
-
 North Macedonia
-
 Norway
-
 Oman
-
 Pakistan
-
 Palestine
-
 Panama
-
 Papua New Guinea
-
 Paraguay
-
 Peru
-
 Philippines
-
 Poland
-
 Portugal
-
 Puerto Rico
-
 Qatar
-
 Reunion
-
 Romania
-
 Rwanda
-
 Saudi Arabia
-
 Serbia
-
 Singapore
-
 Slovakia
-
 Slovenia
-
 Somalia
-
 South Africa
-
 Spain
-
 Sri Lanka
-
 Sweden
-
 Switzerland
-
 Syria
-
 Taiwan
-
 Tajikistan
-
 Tanzania
-
 Thailand
-
 Trinidad and Tobago
-
 Tunisia
-
 Turkey
-
 UAE
-
 Uganda
-
 Ukraine
-
 United Kingdom
-
United States
-
 Uruguay
-
 Uzbekistan
-
 Venezuela
-
 Vietnam
-
 Yemen
-
 Zambia
-
 Zimbabwe
- Forex
- Crypto










Live News


