

Render price prediction: Will consolidation hold as RENDER remains pressured near $1.32?

Render (RENDER) is currently trading at $1.321, below the MA-20 ($1.4044), MA-50 ($1.7170), and MA-200 ($2.3916), reflecting a decisive downtrend across all major timeframes. The Ichimoku Kijun at $1.3920 serves as immediate resistance.
RENDER price prediction
Current price:
$1.228
-0.13
9.57%
Real-time Data
10:38
Daily range
1.19
 1.286
1.286
Weekly range
1.2310
1.4960
1.4960
Loading...
Highlights
- Render (RNDR) is trading at $1.321, below MA-20 ($1.4044), MA-50 ($1.7170), and MA-200 ($2.3916), indicating persistent selling pressure across all timeframes.
- Momentum indicators (MACD, ADX) and oscillators (RSI, CCI) confirm a strong bearish trend with no immediate signs of reversal or oversold conditions.
- For the next five days, RNDR is expected to consolidate between $1.18 and $1.45; a break below $1.30 signals downside risk, while $1.39 (Ichimoku Kijun) acts as immediate resistance.
Sustained bearish momentum as all indicators align with selling
Momentum signals for RENDER are decisively bearish, as indicated by the MACD and ADX, both confirming a strong and persistent downtrend. RSI and Commodity Channel Index do not point to oversold conditions, while Stochastic RSI remains neutral, suggesting the absence of sharp reversal signals. Bull/Bear Power shows limited buyer strength, and the Awesome Oscillator reflects a neutral stance in line with the prevailing bearish momentum. With current prices near the daily low and price action tightly aligned with these signals, there is clear evidence of sustained selling pressure.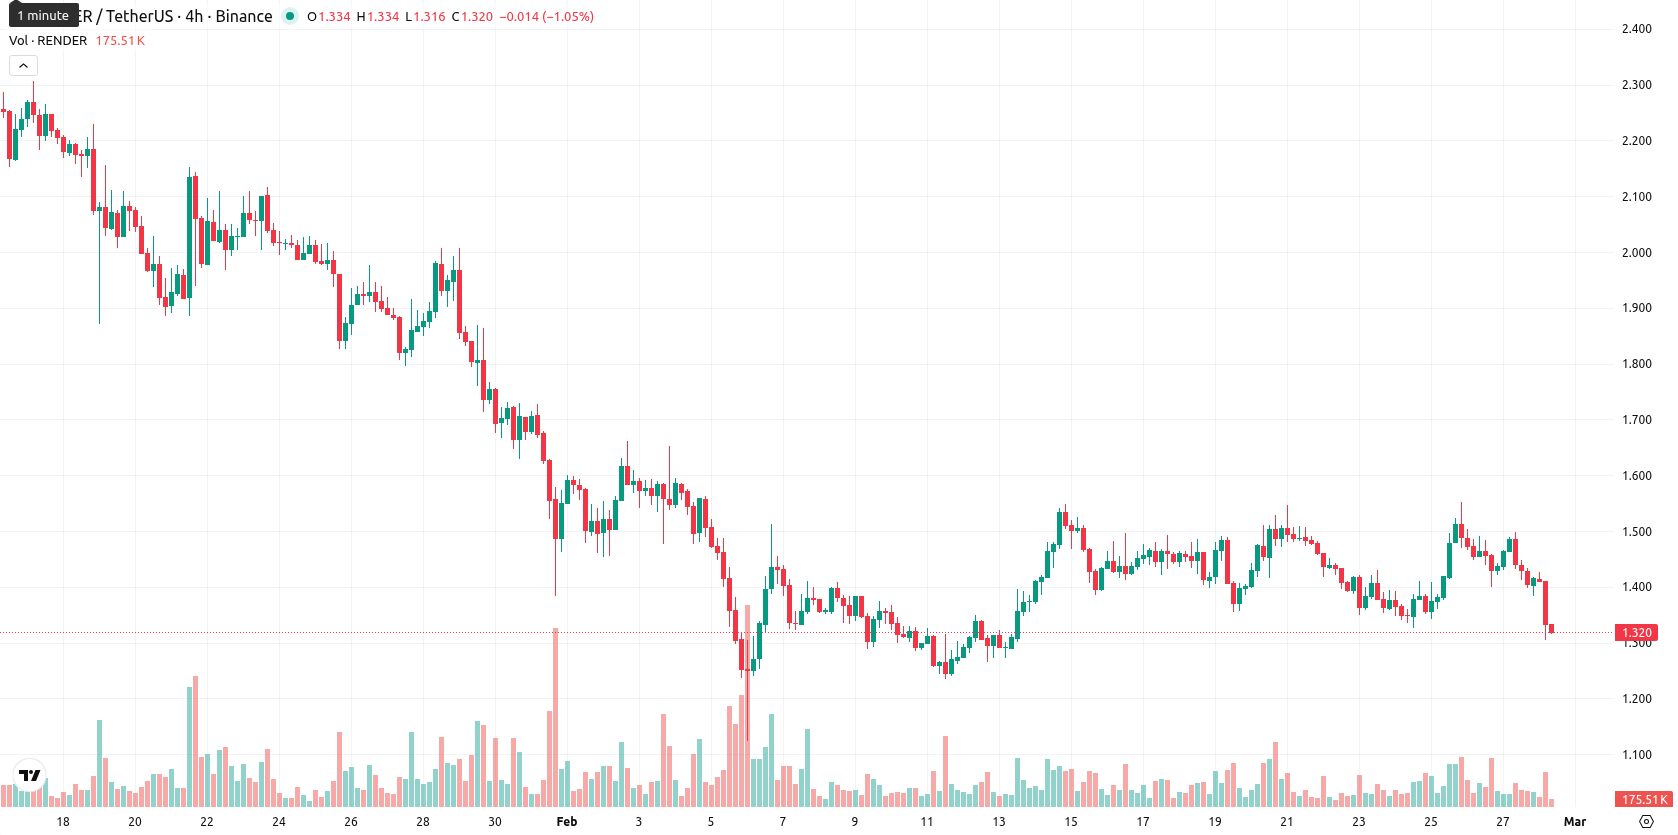
Rangebound outlook as persistent selling limits upside potential
Over the next five trading days, RENDER is likely to trade within a volatility band of $1.18 to $1.45, based on current levels and recent price fluctuations. All major weekly technical signals — including MA-50, RSI, ADX, and MACD — indicate persistent selling, resulting in a low probability (below 20%) of a significant price increase. The baseline expectation is for price consolidation within this band, while a break above the $1.39 resistance (Ichimoku Kijun) would suggest a bullish scenario, and a move below the $1.30 support could open further downside risk.
Anton Kharitonov, expert at Traders Union, sees RENDER in a decisive technical downtrend with no bullish signals emerging. He notes that all key indicators, including MA and momentum tools, favor continued selling pressure. The analyst remains cautious and expects price action to stay capped below resistance at $1.39, with risks skewed to the downside if $1.30 does not hold. "Unless buyers reclaim key resistance levels, I see no compelling reason to expect a reversal here."
Previously it was reported that Render is experiencing sustained bearish pressure, trading below its short, medium, and long-term moving averages, with technical indicators such as MACD, ADX, RSI, and CCI signaling that sellers remain dominant but the market is not yet strongly oversold. Support and resistance are defined by the Ichimoku Kijun and MA-20 levels respectively, while high volatility and downside momentum persist according to price action and momentum signals.
Source of Data:
RENDER Price Analysis by TU
The analysis is based on a proprietary model combining technical, on-chain, and expert data. Not investment advice. See
methodology
The information is based on forecasts and does not constitute investment advice or a guarantee of future results. Market conditions may change. See our Disclaimer and Editorial Integrity for details.
Subscribe to TU news


Did you like the article?





Top News


Top 5 companies for you

United States
-
 Afghanistan
-
 Albania
-
 Algeria
-
 Angola
-
 Argentina
-
 Armenia
-
 Australia
-
 Austria
-
 Azerbaijan
-
 Bahamas
-
 Bahrain
-
 Bangladesh
-
 Belarus
-
 Belgium
-
 Bolivia
-
 Botswana
-
 Brazil
-
 Brunei
-
 Bulgaria
-
 Cambodia
-
 Cameroon
-
 Canada
-
 Chile
-
 China
-
 Colombia
-
 Congo
-
 Costa Rica
-
 Cote d'Ivoire
-
 Croatia
-
 Cuba
-
 Cyprus
-
 Czechia
-
 DR Congo
-
 Denmark
-
 Dominican Republic
-
 Ecuador
-
 Egypt
-
 El Salvador
-
 Estonia
-
 Eswatini
-
 Ethiopia
-
 Finland
-
 France
-
 Georgia
-
 Germany
-
 Ghana
-
 Greece
-
 Haiti
-
 Hong Kong
-
 Hungary
-
 India
-
 Indonesia
-
 Iran, Islamic republic
-
 Iraq
-
 Ireland
-
 Israel
-
 Italy
-
 Jamaica
-
 Japan
-
 Jordan
-
 Kazakhstan
-
 Kenya
-
 Korea
-
 Kuwait
-
 Kyrgyzstan
-
 Laos
-
 Latvia
-
 Lebanon
-
 Lesotho
-
 Libya
-
 Lithuania
-
 Luxembourg
-
 Madagascar
-
 Malaysia
-
 Malta
-
 Mauritius
-
 Mexico
-
 Moldova
-
 Mongolia
-
 Montenegro
-
 Morocco
-
 Mozambique
-
 Myanmar
-
 Namibia
-
 Nepal
-
 Netherlands
-
 New Zealand
-
 Nigeria
-
 North Macedonia
-
 Norway
-
 Oman
-
 Pakistan
-
 Palestine
-
 Panama
-
 Papua New Guinea
-
 Paraguay
-
 Peru
-
 Philippines
-
 Poland
-
 Portugal
-
 Puerto Rico
-
 Qatar
-
 Reunion
-
 Romania
-
 Rwanda
-
 Saudi Arabia
-
 Serbia
-
 Singapore
-
 Slovakia
-
 Slovenia
-
 Somalia
-
 South Africa
-
 Spain
-
 Sri Lanka
-
 Sweden
-
 Switzerland
-
 Syria
-
 Taiwan
-
 Tajikistan
-
 Tanzania
-
 Thailand
-
 Trinidad and Tobago
-
 Tunisia
-
 Turkey
-
 UAE
-
 Uganda
-
 Ukraine
-
 United Kingdom
-
United States
-
 Uruguay
-
 Uzbekistan
-
 Venezuela
-
 Vietnam
-
 Yemen
-
 Zambia
-
 Zimbabwe
- Forex
- Crypto










Live News


