
LINK rises for the week, buoyed by new institutional integrations and steady ETF inflows but struggles below MA-50 – weekly analysis

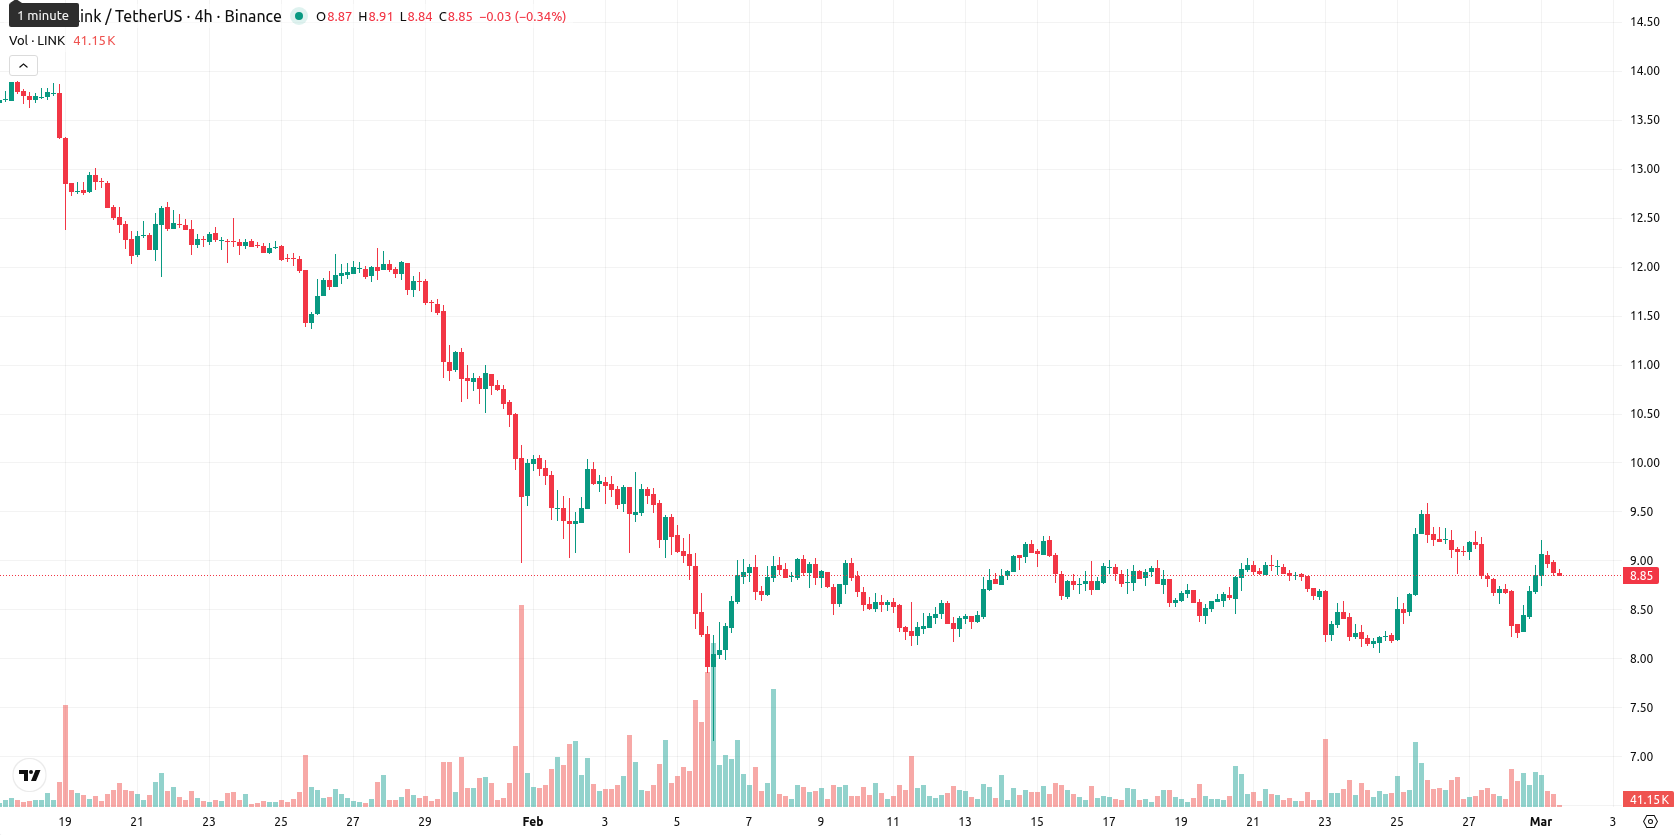
Chainlink (LINK) is currently priced at $8.89, reflecting a weekly increase of $0.57, or 6.8%. On the weekly timeframe, LINK trades above the MA-20 ($8.73) but remains under both the MA-50 ($10.45) and MA-200 ($16.07), indicating near-term bullishness while medium- and long-term momentum continues to favor sellers.
Highlights
- Chainlink (LINK) trades at $8.89, above the MA-20 ($8.73) but well below the MA-50 ($10.45) and MA-200 ($16.07), indicating short-term bullish momentum amid broader weakness.
- Momentum indicators are mixed, with a daily MACD Strong Sell, high ADX at 45.55, RSI at 45.20, and a 6.80% price surge reflecting high volatility.
- Expected range for the next five days is $8.00–$10.00; bearish signals dominate, with a breakout above $10.45 or below $8.53 defining directional bias.
Ecosystem expansion and spot ETF inflows strengthen institutional sentiment this week
Chainlink has expanded its institutional presence through the integration of its data standards with the Canton Network, which supports large-scale U.S. Treasury repo and tokenized asset operations. The project’s ongoing ecosystem growth is illustrated by increasing partnerships and integrations, including the adoption of Chainlink’s technology for wrapped asset bridging on Coinbase. Additionally, U.S.-listed spot Chainlink ETF products have reported steady net inflows since their launch in December 2025.
Mild RSI weakness and prevailing bearish trend shape weekly technical outlook
On the weekly chart, LINK maintains position above the MA-20 ($8.73) but remains below the MA-50 ($10.45) and MA-200 ($16.07). Key dynamic support lies at the Ichimoku Kijun ($8.53), with immediate resistance at the MA-50. Weekly RSI signals mild weakness, hovering just below 50, while the prevailing trend remains bearish due to persistent seller pressure indicated by weekly MACD and elevated ADX. Weekly support is seen at $8.00 and resistance at $10.45.
Rangebound outlook as breakout odds remain low on bearish weekly momentum
For the coming week, LINK is expected to trade within the $8.00 to $10.00 range, mirroring recent sideways momentum. The probability of a significant upward breakout remains below 20% owing to bearish signals from weekly momentum indicators and moving averages. A bullish trigger would require a close above $10.45, opening the way to higher resistance, while a sustained drop below $8.53 may lead to a retest of $8.00 support.
Previously it was reported that Chainlink is exhibiting short-term bullish momentum by trading above its 20-day moving average and Ichimoku Kijun support, but remains below major moving averages, indicating that broader medium- and long-term trends are still bearish. Despite intraday gains and some positive institutional developments, key momentum indicators including MACD and RSI continue to signal persistent downward pressure, favoring a sideways consolidation within a defined range.


-
 Afghanistan
-
 Albania
-
 Algeria
-
 Angola
-
 Argentina
-
 Armenia
-
 Australia
-
 Austria
-
 Azerbaijan
-
 Bahamas
-
 Bahrain
-
 Bangladesh
-
 Belarus
-
 Belgium
-
 Bolivia
-
 Botswana
-
 Brazil
-
 Brunei
-
 Bulgaria
-
 Cambodia
-
 Cameroon
-
 Canada
-
 Chile
Chile
-
 China
China
-
 Colombia
-
 Congo
Congo
-
 Costa Rica
-
 Cote d'Ivoire
-
 Croatia
-
 Cuba
Cuba
-
 Cyprus
-
 Czechia
-
 DR Congo
-
 Denmark
-
 Dominican Republic
-
 Ecuador
-
 Egypt
Egypt
-
 El Salvador
-
 Estonia
-
 Eswatini
-
 Ethiopia
-
 Finland
-
 France
-
 Georgia
-
 Germany
-
 Ghana
Ghana
-
 Greece
-
 Haiti
Haiti
-
 Hong Kong
-
 Hungary
-
 India
India
-
 Indonesia
-
 Iran, Islamic republic
-
 Iraq
Iraq
-
 Ireland
-
 Israel
-
 Italy
Italy
-
 Jamaica
-
 Japan
Japan
-
 Jordan
-
 Kazakhstan
-
 Kenya
Kenya
-
 Korea
Korea
-
 Kuwait
-
 Kyrgyzstan
-
 Laos
Laos
-
 Latvia
-
 Lebanon
-
 Lesotho
-
 Libya
Libya
-
 Lithuania
-
 Luxembourg
-
 Madagascar
-
 Malaysia
-
 Malta
Malta
-
 Mauritius
-
 Mexico
-
 Moldova
-
 Mongolia
-
 Montenegro
-
 Morocco
-
 Mozambique
-
 Myanmar
-
 Namibia
-
 Nepal
Nepal
-
 Netherlands
-
 New Zealand
-
 Nigeria
-
 North Macedonia
-
 Norway
-
 Oman
Oman
-
 Pakistan
-
 Palestine
-
 Panama
-
 Papua New Guinea
-
 Paraguay
-
 Peru
Peru
-
 Philippines
-
 Poland
-
 Portugal
-
 Puerto Rico
-
 Qatar
Qatar
-
 Reunion
-
 Romania
-
 Rwanda
-
 Saudi Arabia
-
 Serbia
-
 Singapore
-
 Slovakia
-
 Slovenia
-
 Somalia
-
 South Africa
-
 Spain
Spain
-
 Sri Lanka
-
 Sweden
-
 Switzerland
-
 Syria
Syria
-
 Taiwan
-
 Tajikistan
-
 Tanzania
-
 Thailand
-
 Trinidad and Tobago
-
 Tunisia
-
 Turkey
-
 UAE
UAE
-
 Uganda
-
 Ukraine
-
 United Kingdom
-
United States
-
 Uruguay
-
 Uzbekistan
-
 Venezuela
-
 Vietnam
-
 Yemen
Yemen
-
 Zambia
-
 Zimbabwe
- Forex
- Crypto
