
Sandbox drops as bearish momentum persists on low volatility day

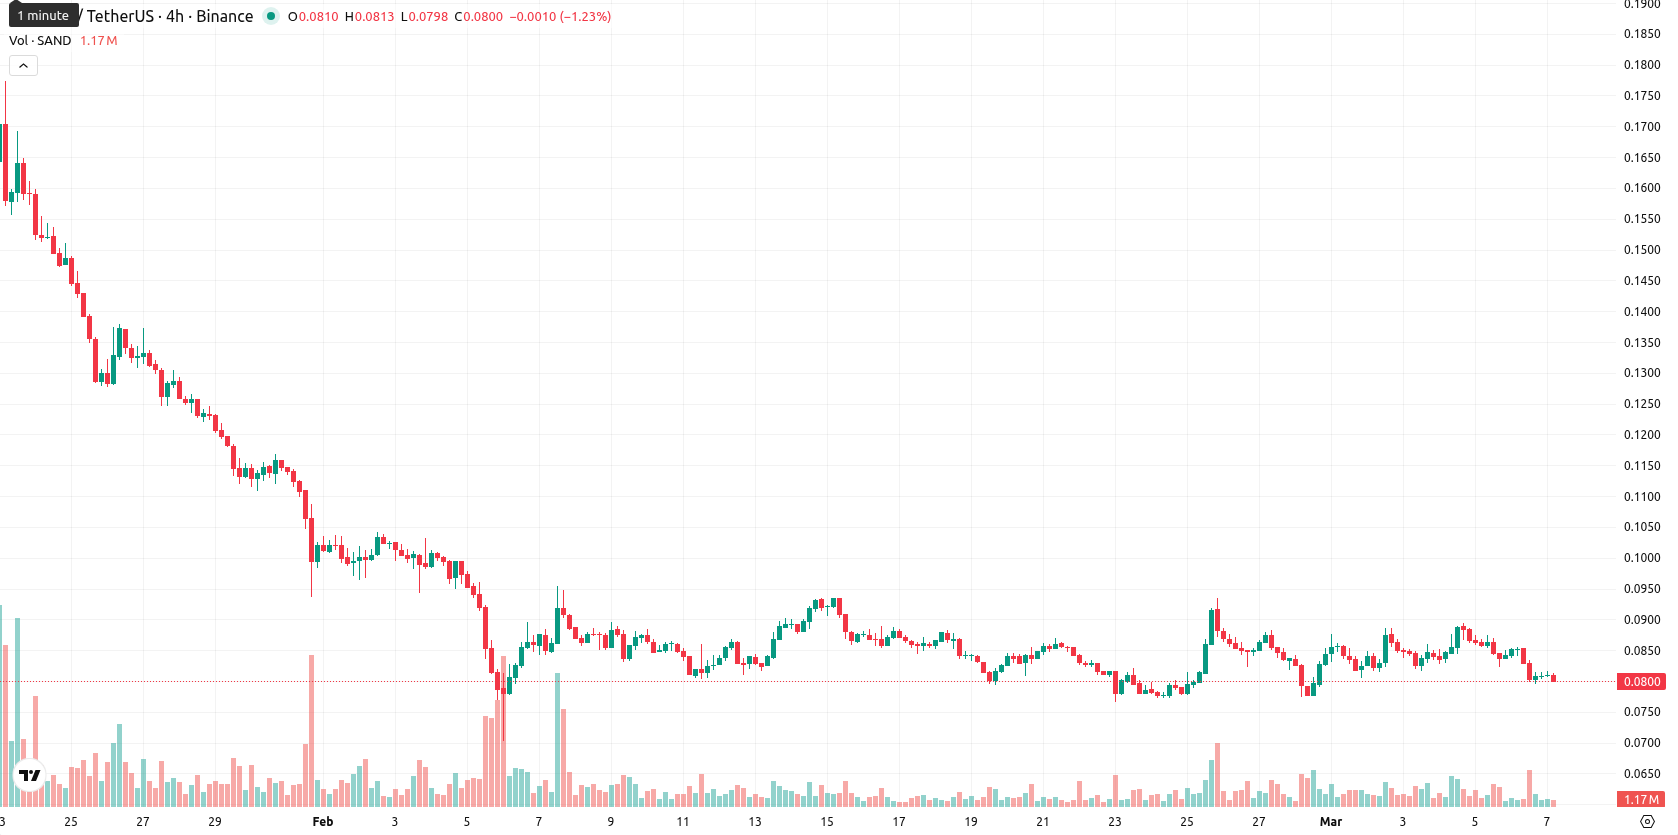
Sandbox (SAND) is trading at $0.08, which is below the MA-20 ($0.0840), MA-50 ($0.1018), and MA-200 ($0.1779). This setup signals persistent selling pressure and confirms bearish short-, medium-, and long-term trends, with immediate resistance at the Ichimoku Kijun level of $0.0851.
Highlights
- SAND remains under sustained selling pressure, trading below key moving averages across all timeframes, confirming a persistent bearish trend.
- Momentum and oscillator signals largely agree on a negative outlook, with no clear oversold condition, and intraday volatility remains low.
- The baseline scenario is consolidation between $0.072 and $0.088, with an 80%+ probability of further downside if $0.0851 resistance holds.
Momentum shift as technical signals confirm ongoing weakness
Momentum indicators reinforce a negative outlook: the MACD and ADX both point to bearish momentum. RSI (41.15) and CCI (–68.96) do not indicate clear oversold conditions, while Stochastic RSI is neutral on daily charts but oversold on most intraday timeframes. Bull/Bear Power shows a modest bid on daily intervals but is outweighed by seller dominance on shorter timeframes, and the Awesome Oscillator remains neutral. SAND has declined sharply today, slipping 5.55% with no meaningful gap between yesterday’s close and today’s open, and price remains near the lower end of a narrow intraday range, reflecting low volatility but ongoing pressure.
Consolidation likely as downside risk outweighs recovery potential
In the short term, SAND is expected to trade within a $0.072 to $0.088 range, reflecting a typical volatility band relative to current levels. The probability of further decline is high (greater than 80%), while upside potential is limited. The base scenario is consolidation between $0.072 and $0.088. A bullish scenario would require a convincing break above the $0.0851 resistance, while continued broader market weakness could see SAND test new lows below $0.072.
Currently, Sandbox (SAND) trades below all major moving averages, with strong bearish momentum signaled by daily MACD, ADX, and sub-50 RSI, indicating persistent selling pressure across timeframes. Oscillator divergence remains as BBP and Awesome Oscillator turn neutral, but with price action at session lows and a sharp daily decline, sellers continue to dominate near-term direction.


Latest Sandbox News


-
 Afghanistan
-
 Albania
-
 Algeria
-
 Angola
-
 Argentina
-
 Armenia
-
 Australia
-
 Austria
-
 Azerbaijan
-
 Bahamas
-
 Bahrain
-
 Bangladesh
-
 Belarus
-
 Belgium
-
 Bolivia
-
 Botswana
-
 Brazil
-
 Brunei
-
 Bulgaria
-
 Cambodia
-
 Cameroon
-
 Canada
-
 Chile
Chile
-
 China
China
-
 Colombia
-
 Congo
Congo
-
 Costa Rica
-
 Cote d'Ivoire
-
 Croatia
-
 Cuba
Cuba
-
 Cyprus
-
 Czechia
-
 DR Congo
-
 Denmark
-
 Dominican Republic
-
 Ecuador
-
 Egypt
Egypt
-
 El Salvador
-
 Estonia
-
 Eswatini
-
 Ethiopia
-
 Finland
-
 France
-
 Georgia
-
 Germany
-
 Ghana
Ghana
-
 Greece
-
 Haiti
Haiti
-
 Hong Kong
-
 Hungary
-
 India
India
-
 Indonesia
-
 Iran, Islamic republic
-
 Iraq
Iraq
-
 Ireland
-
 Israel
-
 Italy
Italy
-
 Jamaica
-
 Japan
Japan
-
 Jordan
-
 Kazakhstan
-
 Kenya
Kenya
-
 Korea
Korea
-
 Kuwait
-
 Kyrgyzstan
-
 Laos
Laos
-
 Latvia
-
 Lebanon
-
 Lesotho
-
 Libya
Libya
-
 Lithuania
-
 Luxembourg
-
 Madagascar
-
 Malaysia
-
 Malta
Malta
-
 Mauritius
-
 Mexico
-
 Moldova
-
 Mongolia
-
 Montenegro
-
 Morocco
-
 Mozambique
-
 Myanmar
-
 Namibia
-
 Nepal
Nepal
-
 Netherlands
-
 New Zealand
-
 Nigeria
-
 North Macedonia
-
 Norway
-
 Oman
Oman
-
 Pakistan
-
 Palestine
-
 Panama
-
 Papua New Guinea
-
 Paraguay
-
 Peru
Peru
-
 Philippines
-
 Poland
-
 Portugal
-
 Puerto Rico
-
 Qatar
Qatar
-
 Reunion
-
 Romania
-
 Rwanda
-
 Saudi Arabia
-
 Serbia
-
 Singapore
-
 Slovakia
-
 Slovenia
-
 Somalia
-
 South Africa
-
 Spain
Spain
-
 Sri Lanka
-
 Sweden
-
 Switzerland
-
 Syria
Syria
-
 Taiwan
-
 Tajikistan
-
 Tanzania
-
 Thailand
-
 Trinidad and Tobago
-
 Tunisia
-
 Turkey
-
 UAE
UAE
-
 Uganda
-
 Ukraine
-
 United Kingdom
-
United States
-
 Uruguay
-
 Uzbekistan
-
 Venezuela
-
 Vietnam
-
 Yemen
Yemen
-
 Zambia
-
 Zimbabwe
- Forex
- Crypto
