

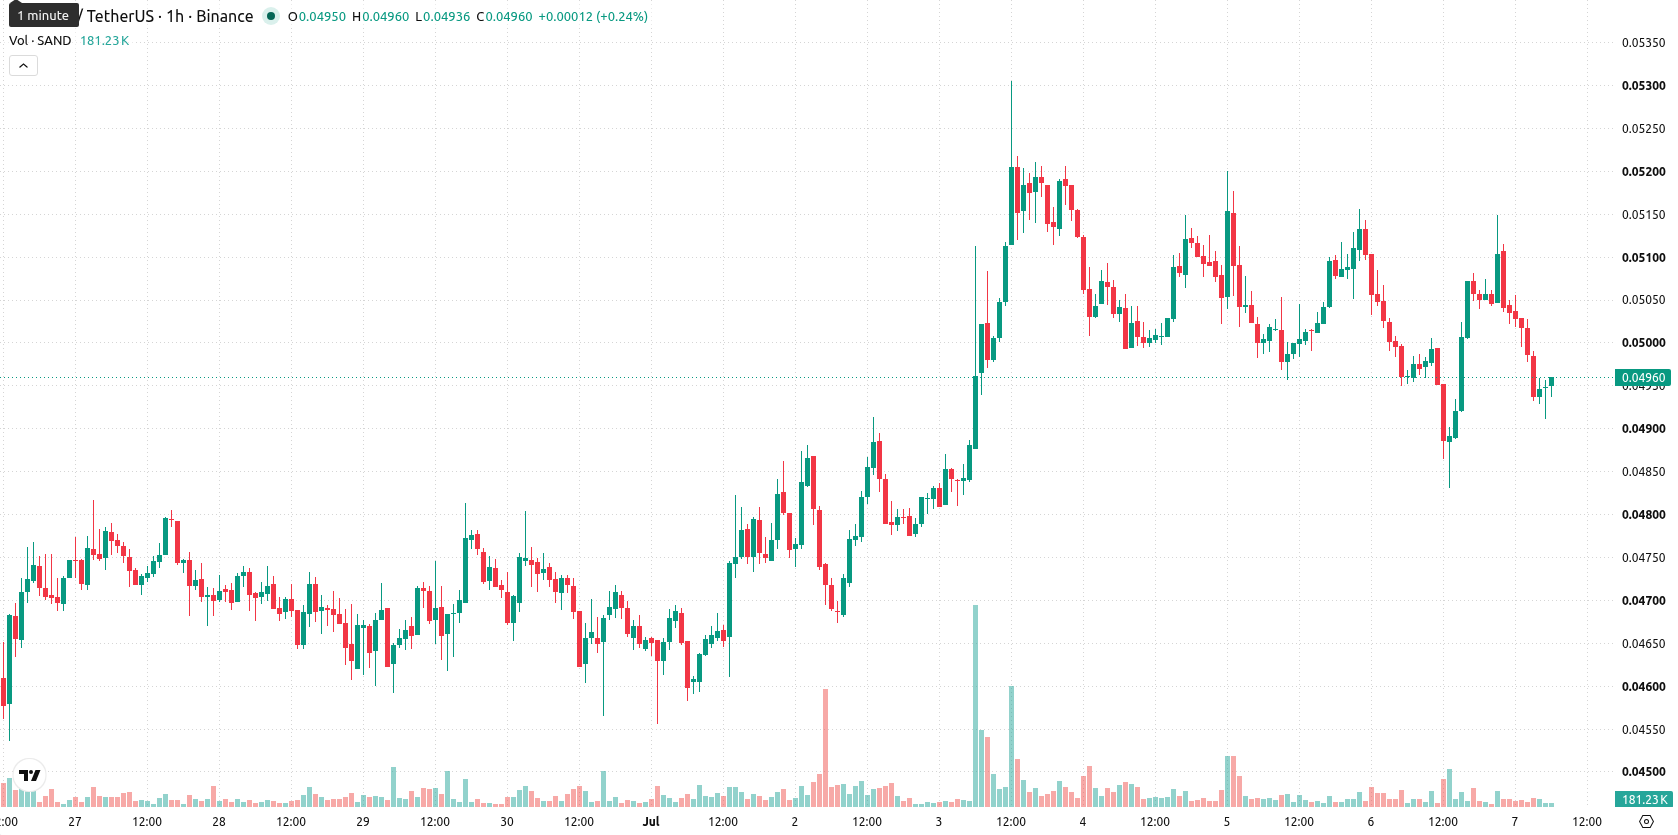
Sandbox (SAND) is trading at $0.0495 after a modest decline for the day, moving slightly lower on high volatility. The price sits below its key moving averages, indicating a lack of short-term momentum.
 0.0488
0.0531
0.0488
0.0531
Highlights
- SAND/USD remains in a firmly bearish trend, trading beneath all major moving averages with strong downside pressure.
- Momentum oscillators largely confirm seller dominance, but oversold conditions hint at possible near-term divergence if buying interest emerges.
- The expected SAND/USD range for the next 2–3 days is $0.0478 to $0.0512, with a 77% probability of further downside unless resistance at $0.0499 breaks.
Bearish momentum persists as SAND tests technical resistance and oversold signals
The price is currently below the MA-20 ($0.05), MA-50 ($0.0502), and MA-200 ($0.0846), highlighting bearish pressure across all major timeframes. The Ichimoku Kijun level at $0.0499 acts as immediate resistance. Technical indicators show the Moving Average Convergence Divergence (MACD) signaling Sell, Average Directional Index (ADX) at Neutral, Relative Strength Index (RSI) at 41.4 flashing Sell, and the Commodity Channel Index (CCI) also signaling Sell. Bull/Bear Power continues to indicate seller dominance. The Stochastic RSI is Oversold, suggesting selling exhaustion may be developing, but this is not confirmed by other oscillators. The Awesome Oscillator also signals Sell, reinforcing the current weak momentum.
Sideways consolidation expected as downside risk overshadows rebound prospects
Over the next two to three trading days, SAND/USD is likely to drift sideways within a typical volatility band, with an expected price range of $0.0478 to $0.0512. There is a 23% probability of an upward move and a 77% chance of further downside. A close above resistance at $0.0499 could prompt a short-term rebound, while a move below support at $0.0478 would indicate greater downside risk.
Earlier, analysts noted that Sandbox (SAND) continued to face persistent bearish momentum despite sporadic buying interest. With broad-based technical signals still favoring sellers and a developing risk of further downside, traders should closely monitor whether SAND sustains support above $0.0478 in the coming sessions as a signal for potential stabilization.














-
 Afghanistan
-
 Albania
-
 Algeria
-
 Angola
-
 Argentina
-
 Armenia
-
 Australia
-
 Austria
-
 Azerbaijan
-
 Bahamas
-
 Bahrain
-
 Bangladesh
-
 Belarus
-
 Belgium
-
 Bolivia
-
 Botswana
-
 Brazil
-
 Brunei
-
 Bulgaria
-
 Cambodia
-
 Cameroon
-
 Canada
-
 Chile
Chile
-
 China
China
-
 Colombia
-
 Congo
Congo
-
 Costa Rica
-
 Cote d'Ivoire
-
 Croatia
-
 Cuba
Cuba
-
 Cyprus
-
 Czechia
-
 DR Congo
-
 Denmark
-
 Dominican Republic
-
 Ecuador
-
 Egypt
Egypt
-
 El Salvador
-
 Estonia
-
 Eswatini
-
 Ethiopia
-
 Finland
-
 France
-
 Georgia
-
 Germany
-
 Ghana
Ghana
-
 Greece
-
 Haiti
Haiti
-
 Hong Kong
-
 Hungary
-
 India
India
-
 Indonesia
-
 Iran, Islamic republic
-
 Iraq
Iraq
-
 Ireland
-
 Israel
-
 Italy
Italy
-
 Jamaica
-
 Japan
Japan
-
 Jordan
-
 Kazakhstan
-
 Kenya
Kenya
-
 Korea
Korea
-
 Kuwait
-
 Kyrgyzstan
-
 Laos
Laos
-
 Latvia
-
 Lebanon
-
 Lesotho
-
 Libya
Libya
-
 Lithuania
-
 Luxembourg
-
 Madagascar
-
 Malaysia
-
 Malta
Malta
-
 Mauritius
-
 Mexico
-
 Moldova
-
 Mongolia
-
 Montenegro
-
 Morocco
-
 Mozambique
-
 Myanmar
-
 Namibia
-
 Nepal
Nepal
-
 Netherlands
-
 New Zealand
-
 Nigeria
-
 North Macedonia
-
 Norway
-
 Oman
Oman
-
 Pakistan
-
 Palestine
-
 Panama
-
 Papua New Guinea
-
 Paraguay
-
 Peru
Peru
-
 Philippines
-
 Poland
-
 Portugal
-
 Puerto Rico
-
 Qatar
Qatar
-
 Reunion
-
 Romania
-
 Rwanda
-
 Saudi Arabia
-
 Serbia
-
 Singapore
-
 Slovakia
-
 Slovenia
-
 Somalia
-
 South Africa
-
 Spain
Spain
-
 Sri Lanka
-
 Sweden
-
 Switzerland
-
 Syria
Syria
-
 Taiwan
-
 Tajikistan
-
 Tanzania
-
 Thailand
-
 Trinidad and Tobago
-
 Tunisia
-
 Turkey
-
 UAE
UAE
-
 Uganda
-
 Ukraine
-
 United Kingdom
-
United States
-
 Uruguay
-
 Uzbekistan
-
 Venezuela
-
 Vietnam
-
 Yemen
Yemen
-
 Zambia
-
 Zimbabwe
- Forex
- Crypto











