

Mixed technical signals meet increased volatility — Render gains 8.19%

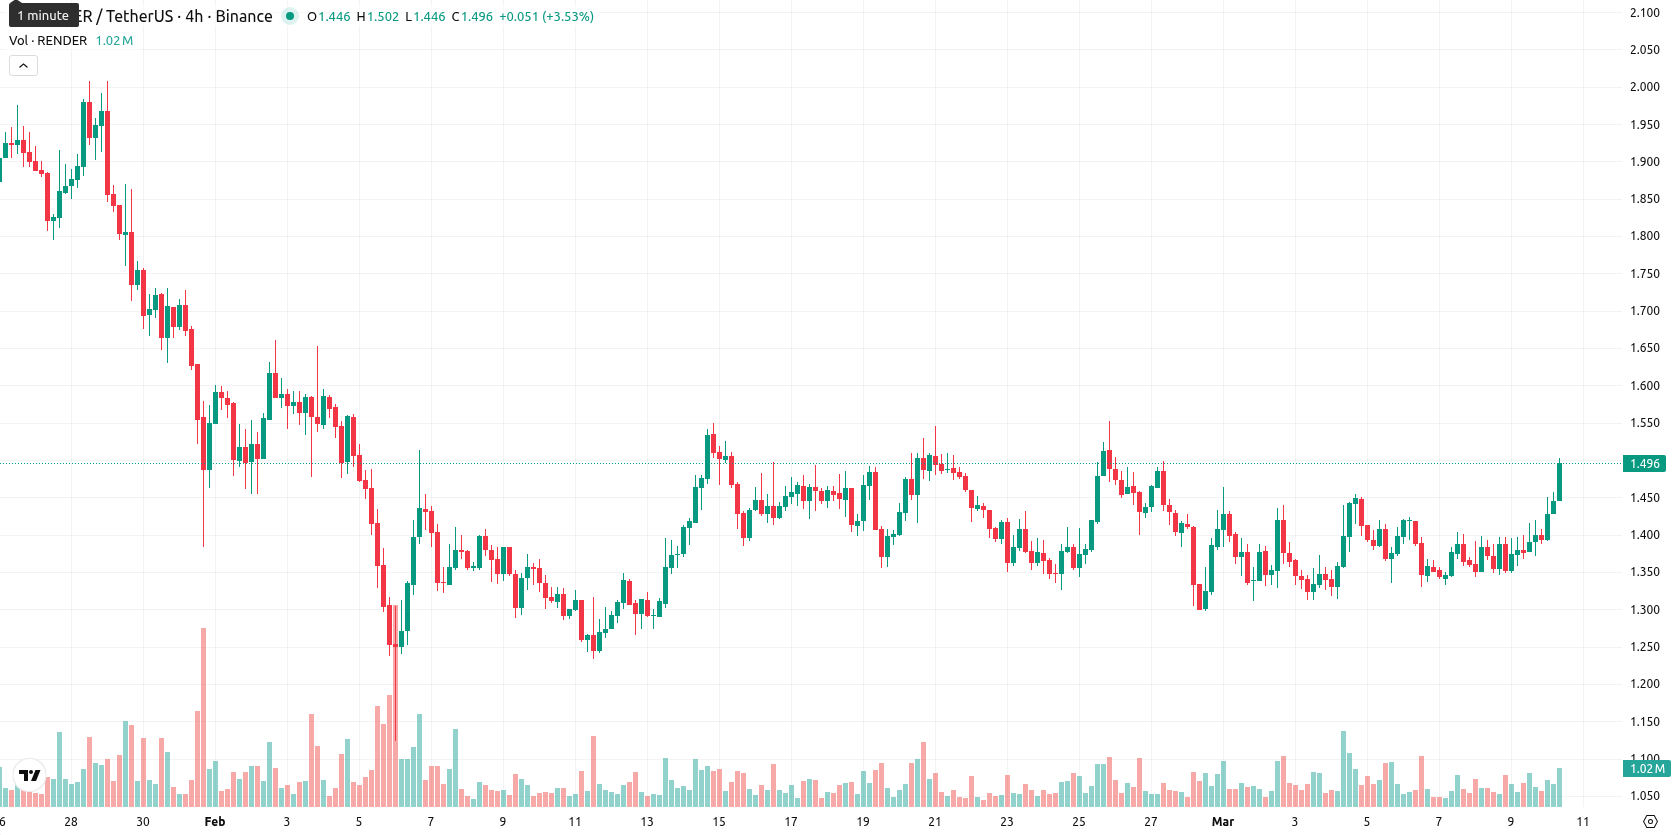
Render (RENDER) is trading at $1.492, advancing 8.19% today. The price stands above the SMA-20 at $1.4000, but remains below the SMA-50 ($1.5325) and the SMA-200 ($2.2687), which underlines a short-term recovery while the broader trend is still bearish.
 1.286
1.4960
Highlights
- RENDER's price shows near-term recovery above short moving averages but faces sustained medium- and long-term bearish pressure.
- Indicators are mixed, with momentum divergences and buyer activity intraday, yet no clear evidence of trend reversal.
- Price is likely to trade sideways between $1.36 and $1.58 next week, with downside risk prevailing if $1.36 support fails.
Mixed momentum as support holds and indicators diverge
Technically, the spot price is above the Ichimoku Kijun on D1 ($1.4085), making this level the nearest support. MACD on D1 indicates strong bearish momentum, while ADX is neutral and low, showing no clear trend. The RSI stands at 47 (leaning bearish), Stoch RSI is near overbought, and CCI is neutral, highlighting mixed momentum and some divergence. BBP shows strong buyer dominance for this session, but the Awesome Oscillator remains neutral as the price trades near session highs amid high intraday volatility.
Downside risk prevails as technical bias favors further losses
For the week ahead, the expected range is $1.36–$1.58, representing a volatility band relative to current levels. The probability of an upward move is low (less than 20%), as weekly RSI, ADX, MACD, and SMA-50 signals favor further downside. Sideways price action between $1.36 and $1.58 is the baseline scenario, with a bullish breakout possible only if $1.58 is breached and a bearish sequence likely if $1.36 support fails.
Previously it was reported that Render (RNDR) continues to face pronounced bearish momentum, trading below its major weekly moving averages with key technical indicators such as MACD and ADX confirming ongoing selling pressure. Oscillators, including RSI and CCI, point to further downside risk without signaling extreme oversold levels, while immediate resistance remains well overhead and the asset is expected to consolidate or drift lower unless a breakout above $1.46 occurs.










-
 Afghanistan
-
 Albania
-
 Algeria
-
 Angola
-
 Argentina
-
 Armenia
-
 Australia
-
 Austria
-
 Azerbaijan
-
 Bahamas
-
 Bahrain
-
 Bangladesh
-
 Belarus
-
 Belgium
-
 Bolivia
-
 Botswana
-
 Brazil
-
 Brunei
-
 Bulgaria
-
 Cambodia
-
 Cameroon
-
 Canada
-
 Chile
-
 China
-
 Colombia
-
 Congo
-
 Costa Rica
-
 Cote d'Ivoire
-
 Croatia
-
 Cuba
-
 Cyprus
-
 Czechia
-
 DR Congo
-
 Denmark
-
 Dominican Republic
-
 Ecuador
-
 Egypt
-
 El Salvador
-
 Estonia
-
 Eswatini
-
 Ethiopia
-
 Finland
-
 France
-
 Georgia
-
 Germany
-
 Ghana
-
 Greece
-
 Haiti
-
 Hong Kong
-
 Hungary
-
 India
-
 Indonesia
-
 Iran, Islamic republic
-
 Iraq
-
 Ireland
-
 Israel
-
 Italy
-
 Jamaica
-
 Japan
-
 Jordan
-
 Kazakhstan
-
 Kenya
-
 Korea
-
 Kuwait
-
 Kyrgyzstan
-
 Laos
-
 Latvia
-
 Lebanon
-
 Lesotho
-
 Libya
-
 Lithuania
-
 Luxembourg
-
 Madagascar
-
 Malaysia
-
 Malta
-
 Mauritius
-
 Mexico
-
 Moldova
-
 Mongolia
-
 Montenegro
-
 Morocco
-
 Mozambique
-
 Myanmar
-
 Namibia
-
 Nepal
-
 Netherlands
-
 New Zealand
-
 Nigeria
-
 North Macedonia
-
 Norway
-
 Oman
-
 Pakistan
-
 Palestine
-
 Panama
-
 Papua New Guinea
-
 Paraguay
-
 Peru
-
 Philippines
-
 Poland
-
 Portugal
-
 Puerto Rico
-
 Qatar
-
 Reunion
-
 Romania
-
 Rwanda
-
 Saudi Arabia
-
 Serbia
-
 Singapore
-
 Slovakia
-
 Slovenia
-
 Somalia
-
 South Africa
-
 Spain
-
 Sri Lanka
-
 Sweden
-
 Switzerland
-
 Syria
-
 Taiwan
-
 Tajikistan
-
 Tanzania
-
 Thailand
-
 Trinidad and Tobago
-
 Tunisia
-
 Turkey
-
 UAE
-
 Uganda
-
 Ukraine
-
 United Kingdom
-
United States
-
 Uruguay
-
 Uzbekistan
-
 Venezuela
-
 Vietnam
-
 Yemen
-
 Zambia
-
 Zimbabwe
- Forex
- Crypto












