
TRUMP falls after momentum indicators maintain bearish signals and price hovers near intraday low

Official Trump (TRUMP) is trading at $3.13, down 7.07% on the day and sitting below the SMA-20 ($3.33), SMA-50 ($3.39), and SMA-200 ($5.62), indicating persistent downside pressure across short-, medium-, and long-term timeframes.
Highlights
- TRUMP trades below all major moving averages, confirming persistent downside pressure across short-, medium-, and long-term outlooks.
- Daily momentum and trend indicators are firmly bearish, with only minor signs of potential near-term oversold bounce.
- Expected price action is range-bound between $3.00 and $3.25, with a breakdown below $3.00 likely if bearish momentum continues.
Bearish signals strengthen as support erodes and intraday volatility rises
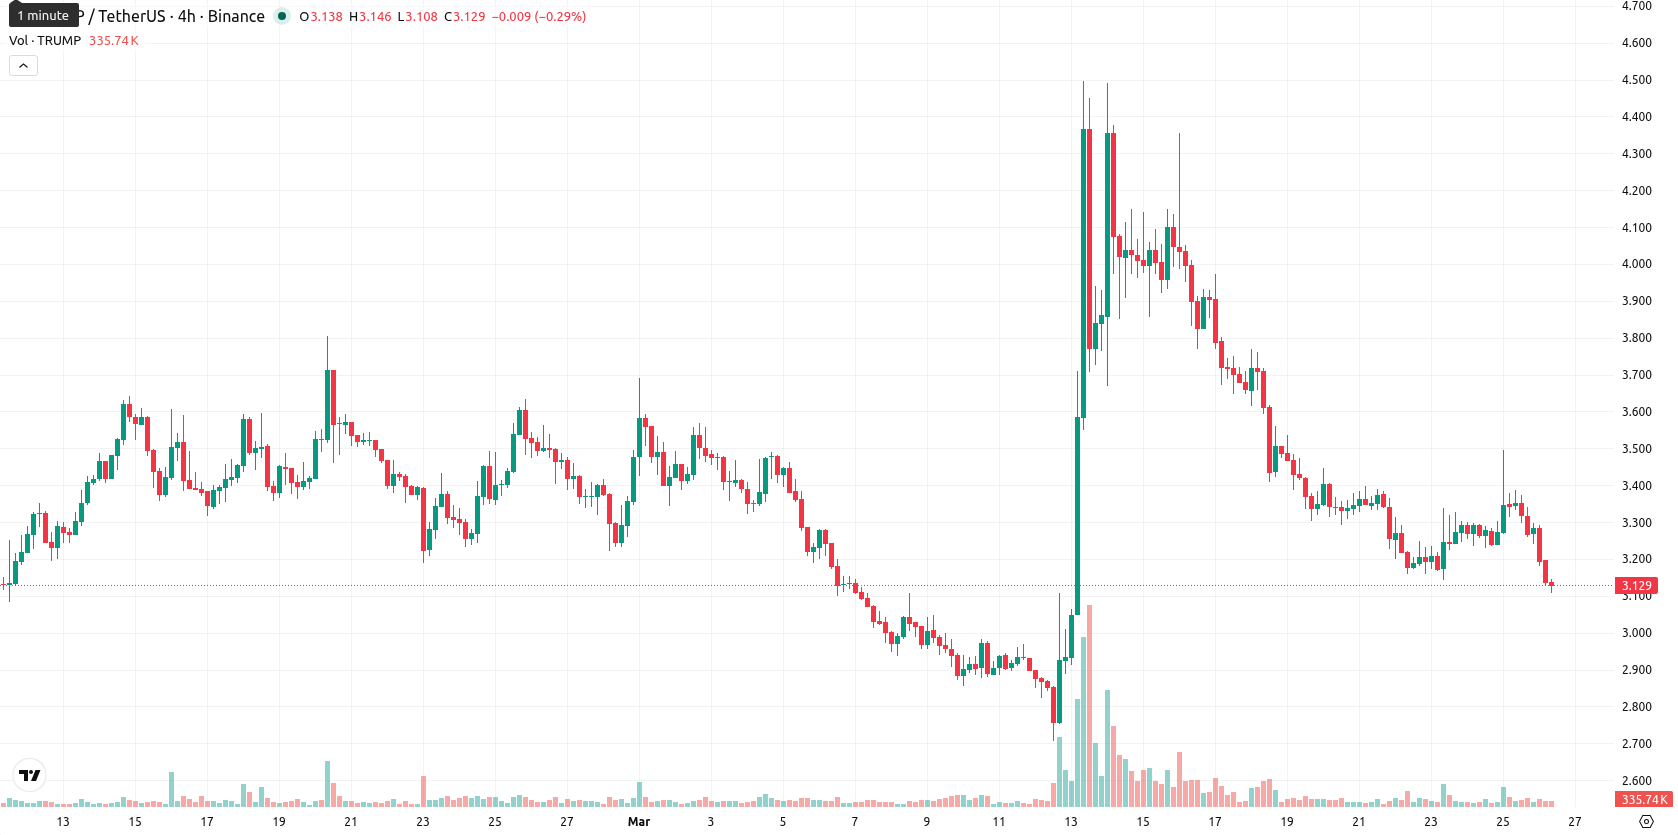
At $3.13, TRUMP is trading below the SMA-20 ($3.33), SMA-50 ($3.39), and SMA-200 ($5.62), which signals persistent downside pressure across short-, medium-, and long-term horizons. The Ichimoku Kijun level is $3.60, just above the current price, highlighting $3.60 as immediate resistance. Momentum indicators on the D1 chart show that MACD, ADX, and RSI all signal a prevailing bearish trend, with MACD and RSI both on "Sell" and ADX confirming modest trend strength. Both RSI (45.65) and CCI are neutral-to-weak, while Stoch RSI is also neutral but signaling oversold conditions on shorter intraday timeframes, suggesting some potential for a near-term bounce. BBP’s value is slightly positive and forecast as "Buy", hinting at minor buyer presence intraday despite sellers dominating the broader trend. The Awesome Oscillator also points downward, reinforcing the prevailing weakness. TRUMP is down $0.24 or 7.07% on the day with no gap between the previous close and today’s open; price currently sits near the low of today's $3.11 – $3.29 range, reflecting high intraday volatility and persistent pressure after the open. The overall tone is bearish, and the daily loss is in line with the momentum signals, with only minor divergence indicated by oscillators hinting at short-term oversold conditions.
Sideways range likely as weekly downside momentum tempers rebound odds
For the coming five trading days, a price band between $3.00 and $3.25 aligns with typical volatility relative to current levels. The probability of a price increase is under 20%, as all major W1 indicators — RSI, ADX, MACD, and MA-50 — remain bearish. Sideways movement inside this corridor is the baseline scenario as selling pressure appears likely to slow. A break above $3.60 would be needed for a bullish reversal, while a sustained breakdown below $3.00 could drive further losses if downward momentum persists.
Earlier, analysts highlighted persistent bearish pressure on TRUMP amid mostly negative technical signals and low odds of a near-term rally. With the latest breakdown below all major moving averages and tightening volatility, traders should monitor for a decisive move under $3.00 as a potential trigger for renewed downside momentum.


Latest TRUMP News


-
 Afghanistan
-
 Albania
-
 Algeria
-
 Angola
-
 Argentina
-
 Armenia
-
 Australia
-
 Austria
-
 Azerbaijan
-
 Bahamas
-
 Bahrain
-
 Bangladesh
-
 Belarus
-
 Belgium
-
 Bolivia
-
 Botswana
-
 Brazil
-
 Brunei
-
 Bulgaria
-
 Cambodia
-
 Cameroon
-
 Canada
-
 Chile
Chile
-
 China
China
-
 Colombia
-
 Congo
Congo
-
 Costa Rica
-
 Cote d'Ivoire
-
 Croatia
-
 Cuba
Cuba
-
 Cyprus
-
 Czechia
-
 DR Congo
-
 Denmark
-
 Dominican Republic
-
 Ecuador
-
 Egypt
Egypt
-
 El Salvador
-
 Estonia
-
 Eswatini
-
 Ethiopia
-
 Finland
-
 France
-
 Georgia
-
 Germany
-
 Ghana
Ghana
-
 Greece
-
 Haiti
Haiti
-
 Hong Kong
-
 Hungary
-
 India
India
-
 Indonesia
-
 Iran, Islamic republic
-
 Iraq
Iraq
-
 Ireland
-
 Israel
-
 Italy
Italy
-
 Jamaica
-
 Japan
Japan
-
 Jordan
-
 Kazakhstan
-
 Kenya
Kenya
-
 Korea
Korea
-
 Kuwait
-
 Kyrgyzstan
-
 Laos
Laos
-
 Latvia
-
 Lebanon
-
 Lesotho
-
 Libya
Libya
-
 Lithuania
-
 Luxembourg
-
 Madagascar
-
 Malaysia
-
 Malta
Malta
-
 Mauritius
-
 Mexico
-
 Moldova
-
 Mongolia
-
 Montenegro
-
 Morocco
-
 Mozambique
-
 Myanmar
-
 Namibia
-
 Nepal
Nepal
-
 Netherlands
-
 New Zealand
-
 Nigeria
-
 North Macedonia
-
 Norway
-
 Oman
Oman
-
 Pakistan
-
 Palestine
-
 Panama
-
 Papua New Guinea
-
 Paraguay
-
 Peru
Peru
-
 Philippines
-
 Poland
-
 Portugal
-
 Puerto Rico
-
 Qatar
Qatar
-
 Reunion
-
 Romania
-
 Rwanda
-
 Saudi Arabia
-
 Serbia
-
 Singapore
-
 Slovakia
-
 Slovenia
-
 Somalia
-
 South Africa
-
 Spain
Spain
-
 Sri Lanka
-
 Sweden
-
 Switzerland
-
 Syria
Syria
-
 Taiwan
-
 Tajikistan
-
 Tanzania
-
 Thailand
-
 Trinidad and Tobago
-
 Tunisia
-
 Turkey
-
 UAE
UAE
-
 Uganda
-
 Ukraine
-
 United Kingdom
-
United States
-
 Uruguay
-
 Uzbekistan
-
 Venezuela
-
 Vietnam
-
 Yemen
Yemen
-
 Zambia
-
 Zimbabwe
- Forex
- Crypto
