
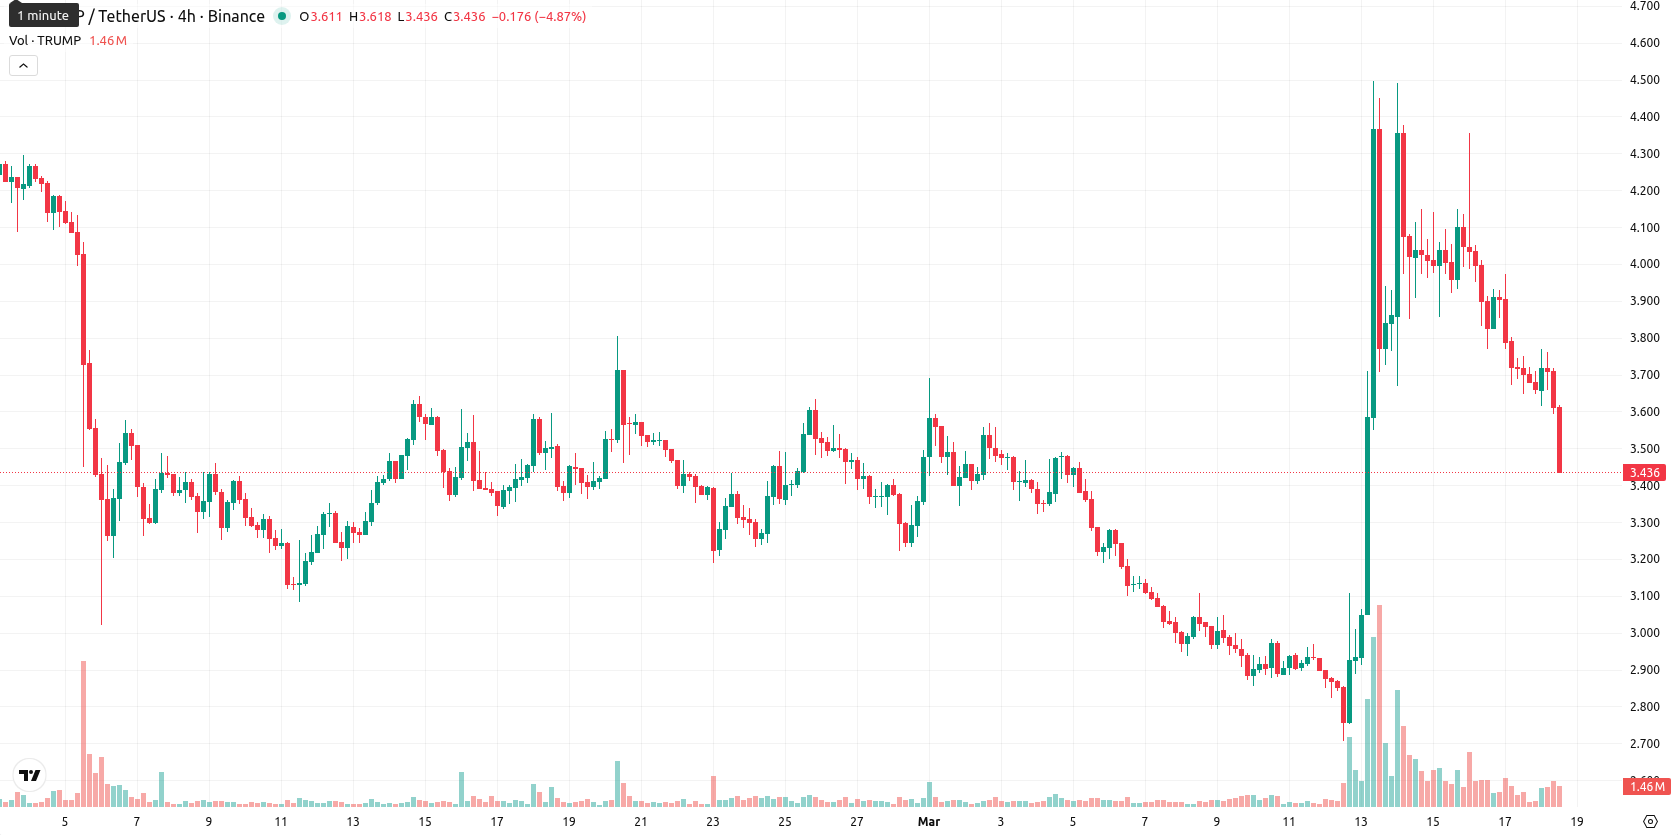
Bearish technicals and heavy intraday selling: TRUMP drops 7.44%

Official Trump (TRUMP) is currently trading at $3.45, down 7.44% on the day. The asset is above its MA-20 ($3.38), but remains under the MA-50 ($3.57) and well below the MA-200 ($5.83), highlighting persistent long-term bearish pressure even as some short-term support persists.
Highlights
- TRUMP faces persistent long-term bearish pressure, trading well below key long-term moving average resistance levels.
- Recent price action exhibits high volatility and strong intraday selling, with momentum signals divided between short-term upside and dominant downside pressure.
- For the next five sessions, price is likely to range between $3.15 support and $3.60 resistance, with a sub-20% probability of an upward move.
Momentum mixed as resistance holds amid intraday selling
TRUMP remains technically weak, caught between shorter-term support and long-term resistance. The Ichimoku Kijun level on the daily chart sits at $3.60 and now acts as immediate resistance. Daily MACD readings are neutral while ADX shows a strengthening bullish trend; RSI at 55.4 and CCI at 85.23 favor moderate upside, but Stoch RSI appears neutral and signals oversold conditions on lower timeframes. Bull/Bear Power indicates buyer dominance on the daily timeframe, though strong intraday selling pressure and volatility after the open favor further downside.
Downtrend bias persists amid low breakout likelihood and range-bound trade
Over the next five trading days, TRUMP is expected to fluctuate within a volatility band of $3.15 to $3.80. The likelihood of a price increase remains low (below 20%), with a price decline more probable. Baseline expectations suggest sideways movement bounded by support at $3.15 and resistance at $3.60. Should a bullish breakout occur with a close above $3.60, the next target is $3.80; a drop below $3.15 could lead to deeper declines, consistent with the broader downtrend.
Earlier, analysts noted that Netflix could face heightened costs and strategic uncertainty if tariffs were imposed on foreign film and TV productions under Trump administration proposals. With TRUMP displaying sustained technical weakness and low odds of a near-term rally, traders should monitor for a decisive break below $3.15 as a signal of possible accelerated downside risk.


Latest TRUMP News


-
 Afghanistan
-
 Albania
-
 Algeria
-
 Angola
-
 Argentina
-
 Armenia
-
 Australia
-
 Austria
-
 Azerbaijan
-
 Bahamas
-
 Bahrain
-
 Bangladesh
-
 Belarus
-
 Belgium
-
 Bolivia
-
 Botswana
-
 Brazil
-
 Brunei
-
 Bulgaria
-
 Cambodia
-
 Cameroon
-
 Canada
-
 Chile
Chile
-
 China
China
-
 Colombia
-
 Congo
Congo
-
 Costa Rica
-
 Cote d'Ivoire
-
 Croatia
-
 Cuba
Cuba
-
 Cyprus
-
 Czechia
-
 DR Congo
-
 Denmark
-
 Dominican Republic
-
 Ecuador
-
 Egypt
Egypt
-
 El Salvador
-
 Estonia
-
 Eswatini
-
 Ethiopia
-
 Finland
-
 France
-
 Georgia
-
 Germany
-
 Ghana
Ghana
-
 Greece
-
 Haiti
Haiti
-
 Hong Kong
-
 Hungary
-
 India
India
-
 Indonesia
-
 Iran, Islamic republic
-
 Iraq
Iraq
-
 Ireland
-
 Israel
-
 Italy
Italy
-
 Jamaica
-
 Japan
Japan
-
 Jordan
-
 Kazakhstan
-
 Kenya
Kenya
-
 Korea
Korea
-
 Kuwait
-
 Kyrgyzstan
-
 Laos
Laos
-
 Latvia
-
 Lebanon
-
 Lesotho
-
 Libya
Libya
-
 Lithuania
-
 Luxembourg
-
 Madagascar
-
 Malaysia
-
 Malta
Malta
-
 Mauritius
-
 Mexico
-
 Moldova
-
 Mongolia
-
 Montenegro
-
 Morocco
-
 Mozambique
-
 Myanmar
-
 Namibia
-
 Nepal
Nepal
-
 Netherlands
-
 New Zealand
-
 Nigeria
-
 North Macedonia
-
 Norway
-
 Oman
Oman
-
 Pakistan
-
 Palestine
-
 Panama
-
 Papua New Guinea
-
 Paraguay
-
 Peru
Peru
-
 Philippines
-
 Poland
-
 Portugal
-
 Puerto Rico
-
 Qatar
Qatar
-
 Reunion
-
 Romania
-
 Rwanda
-
 Saudi Arabia
-
 Serbia
-
 Singapore
-
 Slovakia
-
 Slovenia
-
 Somalia
-
 South Africa
-
 Spain
Spain
-
 Sri Lanka
-
 Sweden
-
 Switzerland
-
 Syria
Syria
-
 Taiwan
-
 Tajikistan
-
 Tanzania
-
 Thailand
-
 Trinidad and Tobago
-
 Tunisia
-
 Turkey
-
 UAE
UAE
-
 Uganda
-
 Ukraine
-
 United Kingdom
-
United States
-
 Uruguay
-
 Uzbekistan
-
 Venezuela
-
 Vietnam
-
 Yemen
Yemen
-
 Zambia
-
 Zimbabwe
- Forex
- Crypto
