

Bitcoin price prediction: Can $70,500 support hold as BTC loses 1.39%?

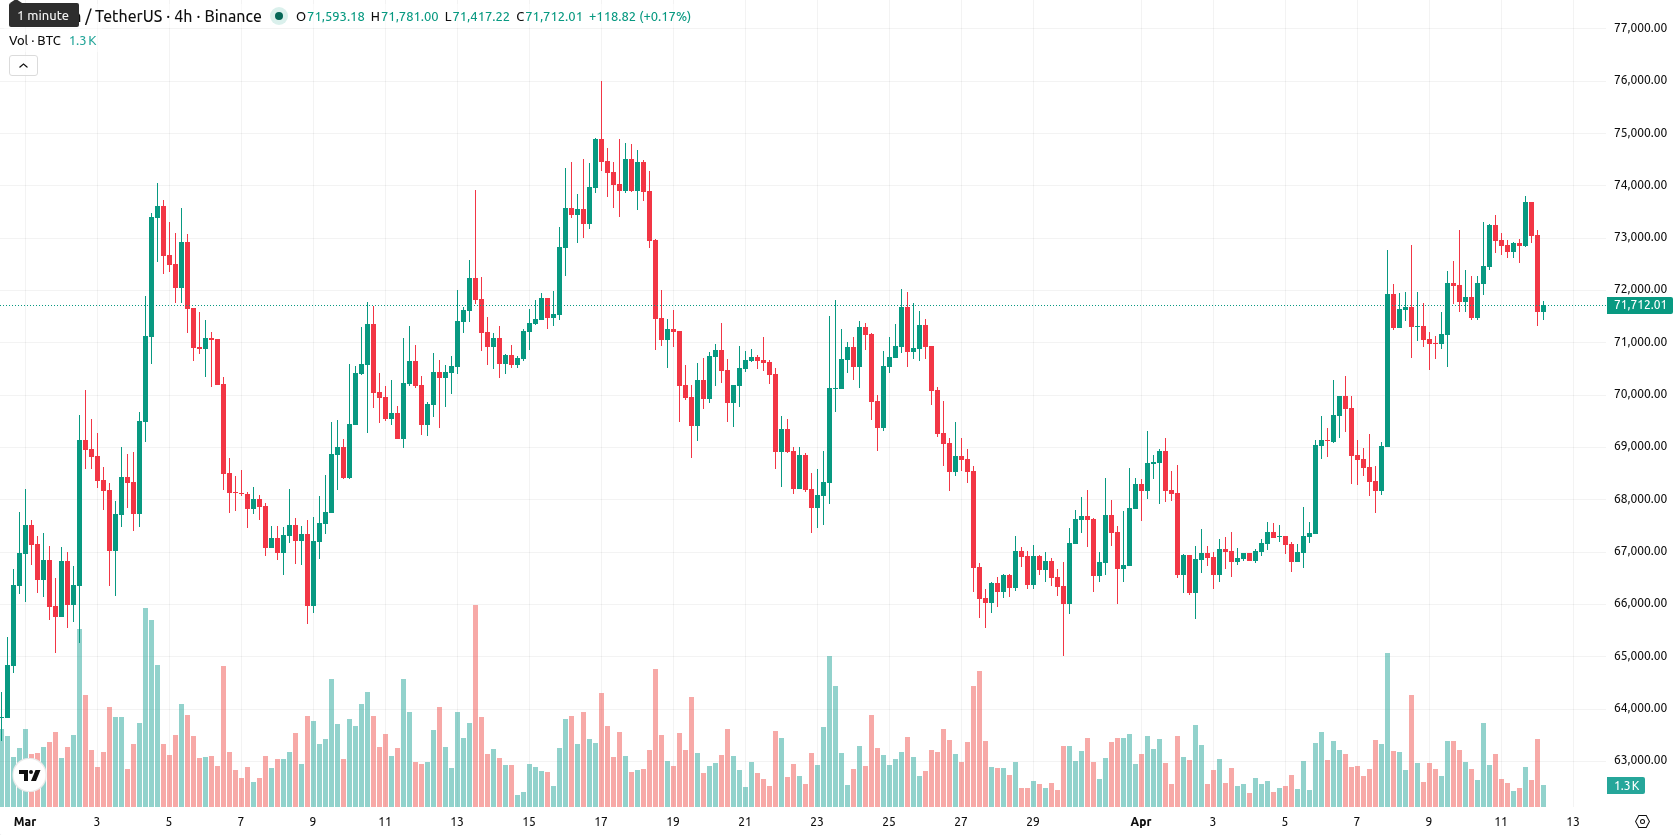
Bitcoin (BTC) is trading at $71,710.19 after declining $1,012.09 or 1.39% from the previous session. The asset is positioned above both its SMA-20 ($69,175.17) and SMA-50 ($69,106.71), maintaining short- and medium-term resilience, but remains below the longer-term SMA-200 ($88,103.31), which indicates lingering downward pressure.
 65002
74217.49
Highlights
- Morgan Stanley launched its spot Bitcoin ETF with $34 million first-day inflows and a low 0.14% management fee, expanding institutional access.
- Spot Bitcoin ETFs now hold $90.3 billion, with rising advisor adoption driving flows, while the SEC reviews crypto ETF option proposals.
- Technical signals are mixed with overbought conditions, high volatility, and expected trading between $69,200 and $73,500 amid downside risk.
Institutional inflows rise as ETF launches and upgrades face selling
The launch of Morgan Stanley's spot Bitcoin ETF (MSBT) occurred on April 12, 2026, with $34 million in first-day inflows and a management fee of 0.14%. Spot Bitcoin ETFs collectively held $90.3 billion in assets and recent daily inflows reached 3,350 BTC, with BlackRock reported as leading on trading volume. Institutional participation has become a key pricing driver as direct access for 16,000 advisors was introduced. The SEC is reviewing a proposal to list Grayscale crypto ETF options, and Bitcoin developers advanced protocol upgrades with the release of version 31.0rc4 on testnet, though price action has remained under broader selling pressure.
Mixed momentum and overbought signals complicate trend confirmation
At $71,710.19, Bitcoin is trading above both its SMA-20 ($69,175.17) and SMA-50 ($69,106.71), signaling resilience in the short and medium term, but it remains below the long-term SMA-200 ($88,103.31) which points to unresolved longer-term downward pressure. The Ichimoku Kijun at $70,500.00 sits below the current price, now acting as immediate support. Momentum signals are mixed: MACD D1 indicates bullish momentum, while ADX at 14.24 suggests a lack of trend strength. Overbought conditions are evident in Stoch RSI and CCI, with RSI remaining moderately positive. BBP signals persistent buyer dominance intraday, but the daily move has been negative, down $1,012.09 or 1.39% from the previous session. Today’s open was slightly higher than the previous close (no gap), but the price quickly reversed and is now near the low of today’s range, reflecting high volatility and heavy pressure after the open. The Awesome Oscillator supports the upward bias on D1, but divergences across timeframes reveal conflicting momentum and overbought signals, creating an unclear short-term picture.
Further downside favored as technical resistance limits upside risk
Looking ahead, the expected trading range for the next five days is $69,200 to $73,500. The probability of a price increase is very low (less than 20%), making a further decline more likely given the prevailing weekly Sell signals from MA-50, MA-100, MACD, ADX, and RSI. The baseline scenario is lateral movement between support and resistance. A bullish scenario would require a sustained break above $73,500, while a bearish case emerges if price falls below the immediate support at $70,500 and challenges the weekly low near $69,200; this range reflects typical volatility band relative to current levels.
Earlier, analysts noted that Bitcoin’s momentum remained positive in the short and medium term, but persistent long-term resistance and heightened geopolitical and regulatory risks warranted caution. Recent ETF inflows and protocol developments add new institutional and technical dimensions, but with mixed signals and a downside bias prevailing, traders should closely monitor for a potential break below key support at $70,500, which could trigger further volatility.











-
 Afghanistan
-
 Albania
-
 Algeria
-
 Angola
-
 Argentina
-
 Armenia
-
 Australia
-
 Austria
-
 Azerbaijan
-
 Bahamas
-
 Bahrain
-
 Bangladesh
-
 Belarus
-
 Belgium
-
 Bolivia
-
 Botswana
-
 Brazil
-
 Brunei
-
 Bulgaria
-
 Cambodia
-
 Cameroon
-
 Canada
-
 Chile
-
 China
-
 Colombia
-
 Congo
-
 Costa Rica
-
 Cote d'Ivoire
-
 Croatia
-
 Cuba
-
 Cyprus
-
 Czechia
-
 DR Congo
-
 Denmark
-
 Dominican Republic
-
 Ecuador
-
 Egypt
-
 El Salvador
-
 Estonia
-
 Eswatini
-
 Ethiopia
-
 Finland
-
 France
-
 Georgia
-
 Germany
-
 Ghana
-
 Greece
-
 Haiti
-
 Hong Kong
-
 Hungary
-
 India
-
 Indonesia
-
 Iran, Islamic republic
-
 Iraq
-
 Ireland
-
 Israel
-
 Italy
-
 Jamaica
-
 Japan
-
 Jordan
-
 Kazakhstan
-
 Kenya
-
 Korea
-
 Kuwait
-
 Kyrgyzstan
-
 Laos
-
 Latvia
-
 Lebanon
-
 Lesotho
-
 Libya
-
 Lithuania
-
 Luxembourg
-
 Madagascar
-
 Malaysia
-
 Malta
-
 Mauritius
-
 Mexico
-
 Moldova
-
 Mongolia
-
 Montenegro
-
 Morocco
-
 Mozambique
-
 Myanmar
-
 Namibia
-
 Nepal
-
 Netherlands
-
 New Zealand
-
 Nigeria
-
 North Macedonia
-
 Norway
-
 Oman
-
 Pakistan
-
 Palestine
-
 Panama
-
 Papua New Guinea
-
 Paraguay
-
 Peru
-
 Philippines
-
 Poland
-
 Portugal
-
 Puerto Rico
-
 Qatar
-
 Reunion
-
 Romania
-
 Rwanda
-
 Saudi Arabia
-
 Serbia
-
 Singapore
-
 Slovakia
-
 Slovenia
-
 Somalia
-
 South Africa
-
 Spain
-
 Sri Lanka
-
 Sweden
-
 Switzerland
-
 Syria
-
 Taiwan
-
 Tajikistan
-
 Tanzania
-
 Thailand
-
 Trinidad and Tobago
-
 Tunisia
-
 Turkey
-
 UAE
-
 Uganda
-
 Ukraine
-
 United Kingdom
-
United States
-
 Uruguay
-
 Uzbekistan
-
 Venezuela
-
 Vietnam
-
 Yemen
-
 Zambia
-
 Zimbabwe
- Forex
- Crypto












