
Theta gains 10.23% as price rebounds from historically low levels

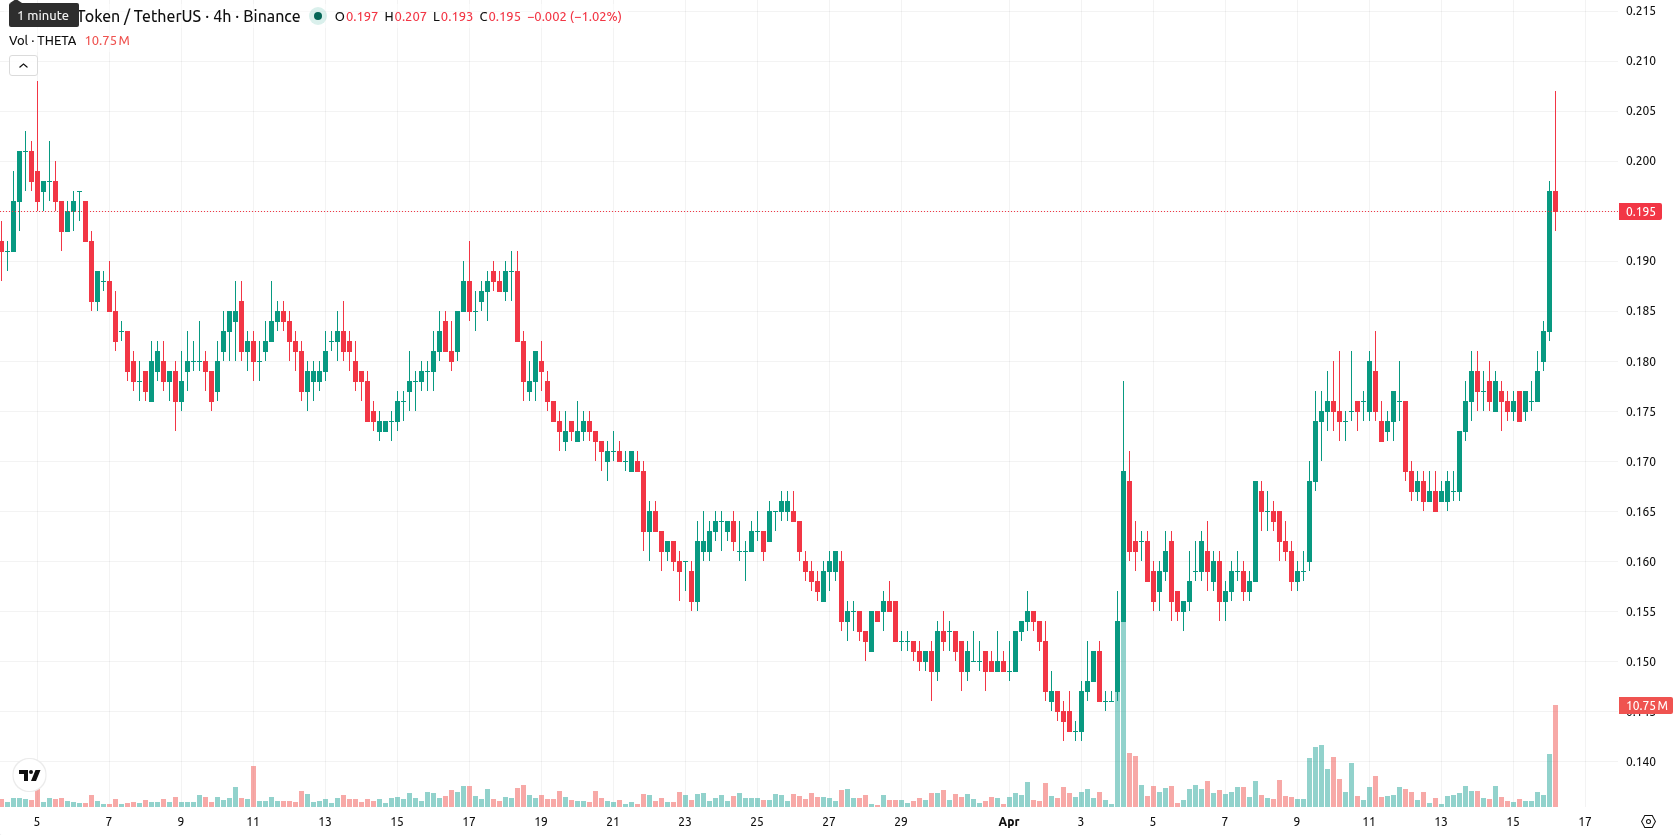
Theta (THETA) is trading at $0.194 after gaining 10.23% on the day. The price remains above the SMA-20 ($0.1611) and SMA-50 ($0.1726), reflecting short- and medium-term bullish momentum but stays well below the SMA-200 ($0.3261), highlighting persistent long-term resistance.
 0.1403
0.1522000
0.1403
0.1522000
Highlights
- THETA trades above short- and medium-term averages, reflecting firm near-term momentum but faces long-term resistance overhead.
- Momentum and volatility indicators signal overbought conditions with buyer dominance, suggesting limited immediate upside despite strong intraday gains.
- Price is expected to consolidate between $0.181 and $0.207 this week, with downside more likely than further gains.
Bullish bias moderates as overbought signals and volatility converge
Technical analysis shows Theta sits above key short-term moving averages, with $0.1630 (Ichimoku Kijun) now acting as immediate support. Momentum indicators are moderately bullish: MACD is neutral, ADX (21.6) suggests an emerging trend, and RSI (58.8) points to modest strength. However, strong overbought signals appear on CCI (131) and Stoch RSI (100), and BBP is positive, confirming buyer dominance. The price gapped up at the open and trades at the top of today's volatile range ($0.182 – $0.207), but overbought conditions could limit further upside.
Downside risk favored as volatility narrows and upside stalls
For the coming week, THETA is likely to move within a typical volatility band of $0.181 – $0.207. The probability of further price gains is low (less than 20%), making a decrease more likely. Baseline scenario anticipates sideways trading in this corridor. A sustained breakout above $0.207 could drive new local highs, but any decline below $0.181 risks deeper retracement toward support, especially if long-term resistance holds.
Earlier, analysts noted that Theta's short-term momentum was at odds with lingering long-term bearish pressures, advising caution as bullish enthusiasm could quickly fade. The current market action reinforces this cautious stance, with heightened overbought signals and persistent resistance suggesting that any failure to hold above $0.181 may trigger sharper downside volatility in the sessions ahead.














-
 Afghanistan
-
 Albania
-
 Algeria
-
 Angola
-
 Argentina
-
 Armenia
-
 Australia
-
 Austria
-
 Azerbaijan
-
 Bahamas
-
 Bahrain
-
 Bangladesh
-
 Belarus
-
 Belgium
-
 Bolivia
-
 Botswana
-
 Brazil
-
 Brunei
-
 Bulgaria
-
 Cambodia
-
 Cameroon
-
 Canada
-
 Chile
Chile
-
 China
China
-
 Colombia
-
 Congo
Congo
-
 Costa Rica
-
 Cote d'Ivoire
-
 Croatia
-
 Cuba
Cuba
-
 Cyprus
-
 Czechia
-
 DR Congo
-
 Denmark
-
 Dominican Republic
-
 Ecuador
-
 Egypt
Egypt
-
 El Salvador
-
 Estonia
-
 Eswatini
-
 Ethiopia
-
 Finland
-
 France
-
 Georgia
-
 Germany
-
 Ghana
Ghana
-
 Greece
-
 Haiti
Haiti
-
 Hong Kong
-
 Hungary
-
 India
India
-
 Indonesia
-
 Iran, Islamic republic
-
 Iraq
Iraq
-
 Ireland
-
 Israel
-
 Italy
Italy
-
 Jamaica
-
 Japan
Japan
-
 Jordan
-
 Kazakhstan
-
 Kenya
Kenya
-
 Korea
Korea
-
 Kuwait
-
 Kyrgyzstan
-
 Laos
Laos
-
 Latvia
-
 Lebanon
-
 Lesotho
-
 Libya
Libya
-
 Lithuania
-
 Luxembourg
-
 Madagascar
-
 Malaysia
-
 Malta
Malta
-
 Mauritius
-
 Mexico
-
 Moldova
-
 Mongolia
-
 Montenegro
-
 Morocco
-
 Mozambique
-
 Myanmar
-
 Namibia
-
 Nepal
Nepal
-
 Netherlands
-
 New Zealand
-
 Nigeria
-
 North Macedonia
-
 Norway
-
 Oman
Oman
-
 Pakistan
-
 Palestine
-
 Panama
-
 Papua New Guinea
-
 Paraguay
-
 Peru
Peru
-
 Philippines
-
 Poland
-
 Portugal
-
 Puerto Rico
-
 Qatar
Qatar
-
 Reunion
-
 Romania
-
 Rwanda
-
 Saudi Arabia
-
 Serbia
-
 Singapore
-
 Slovakia
-
 Slovenia
-
 Somalia
-
 South Africa
-
 Spain
Spain
-
 Sri Lanka
-
 Sweden
-
 Switzerland
-
 Syria
Syria
-
 Taiwan
-
 Tajikistan
-
 Tanzania
-
 Thailand
-
 Trinidad and Tobago
-
 Tunisia
-
 Turkey
-
 UAE
UAE
-
 Uganda
-
 Ukraine
-
 United Kingdom
-
United States
-
 Uruguay
-
 Uzbekistan
-
 Venezuela
-
 Vietnam
-
 Yemen
Yemen
-
 Zambia
-
 Zimbabwe
- Forex
- Crypto











