
Sustained selling pressure pulls Theta down sharply

Theta (THETA) is trading at $0.1352 after a daily drop of 7.65%. The asset is positioned below its key moving averages, reflecting recent downside momentum.
Highlights
- THETA/USD remains under sustained bearish pressure, trading below key moving averages and near intraday lows.
- Momentum and trend indicators are broadly negative, reflecting strong seller dominance without significant bullish divergence.
- Expect THETA/USD to consolidate within the $0.1281–$0.1423 range; a breakdown below $0.1281 would signal further downside risk.
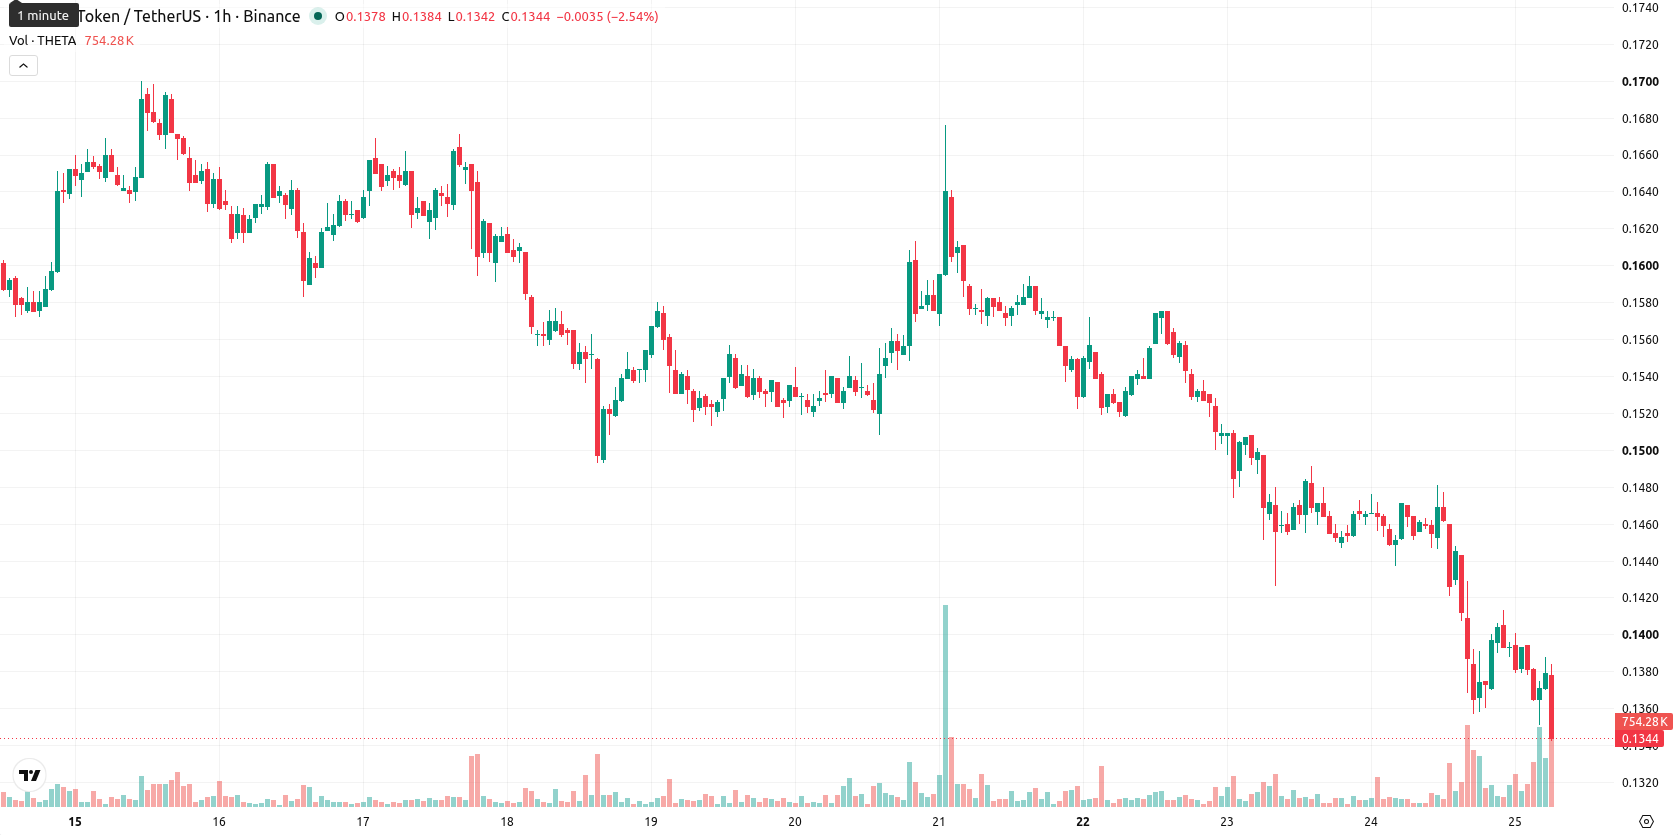
Bearish momentum confirmed as signals and support converge
On the hourly chart, THETA/USD has fallen below the MA-20 at $0.14011 and the MA-50 at $0.143918, as well as the longer-term MA-200 positioned at $0.218241. The immediate resistance is defined by the Ichimoku Kijun at $0.14175, while key support is found at $0.1280669. The technical picture reveals that the Moving Average Convergence Divergence (MACD) signal is strongly bearish, and the Average Directional Index (ADX) remains in sell territory. The Relative Strength Index (RSI) is at 37.96, pointing to a sell bias without entering oversold levels, whereas the Stochastic RSI remains neutral. The Commodity Channel Index (CCI) aligns with a sell signal, Bull/Bear Power reflects intraday seller dominance, and the Awesome Oscillator shows a neutral reading. Volatility remains high, and the negative momentum is corroborated by the technical alignment with no significant divergence among indicators.
Further downside risk rises as consolidation dominates short-term outlook
Over the next 2 to 3 trading days, THETA/USD is likely to fluctuate within a volatility band between $0.1280669 and $0.1423331. The probability of an immediate move to the upside is considered very low, while the probability of a further downside test remains high. The baseline scenario envisions consolidation within this range, with a bullish breakout requiring a clear move above the $0.14175 resistance, and a bearish development expected if the $0.1280669 support level fails to hold.
Earlier, analysts noted that Theta was exhibiting sustained bearish momentum, with technical signals pointing to continued downside risk. Fresh confirmation of this trend comes as indicators now present a unified bearish outlook, making the $0.1280669 support level especially critical for traders anticipating the next directional shift.


-
 Afghanistan
-
 Albania
-
 Algeria
-
 Angola
-
 Argentina
-
 Armenia
-
 Australia
-
 Austria
-
 Azerbaijan
-
 Bahamas
-
 Bahrain
-
 Bangladesh
-
 Belarus
-
 Belgium
-
 Bolivia
-
 Botswana
-
 Brazil
-
 Brunei
-
 Bulgaria
-
 Cambodia
-
 Cameroon
-
 Canada
-
 Chile
Chile
-
 China
China
-
 Colombia
-
 Congo
Congo
-
 Costa Rica
-
 Cote d'Ivoire
-
 Croatia
-
 Cuba
Cuba
-
 Cyprus
-
 Czechia
-
 DR Congo
-
 Denmark
-
 Dominican Republic
-
 Ecuador
-
 Egypt
Egypt
-
 El Salvador
-
 Estonia
-
 Eswatini
-
 Ethiopia
-
 Finland
-
 France
-
 Georgia
-
 Germany
-
 Ghana
Ghana
-
 Greece
-
 Haiti
Haiti
-
 Hong Kong
-
 Hungary
-
 India
India
-
 Indonesia
-
 Iran, Islamic republic
-
 Iraq
Iraq
-
 Ireland
-
 Israel
-
 Italy
Italy
-
 Jamaica
-
 Japan
Japan
-
 Jordan
-
 Kazakhstan
-
 Kenya
Kenya
-
 Korea
Korea
-
 Kuwait
-
 Kyrgyzstan
-
 Laos
Laos
-
 Latvia
-
 Lebanon
-
 Lesotho
-
 Libya
Libya
-
 Lithuania
-
 Luxembourg
-
 Madagascar
-
 Malaysia
-
 Malta
Malta
-
 Mauritius
-
 Mexico
-
 Moldova
-
 Mongolia
-
 Montenegro
-
 Morocco
-
 Mozambique
-
 Myanmar
-
 Namibia
-
 Nepal
Nepal
-
 Netherlands
-
 New Zealand
-
 Nigeria
-
 North Macedonia
-
 Norway
-
 Oman
Oman
-
 Pakistan
-
 Palestine
-
 Panama
-
 Papua New Guinea
-
 Paraguay
-
 Peru
Peru
-
 Philippines
-
 Poland
-
 Portugal
-
 Puerto Rico
-
 Qatar
Qatar
-
 Reunion
-
 Romania
-
 Rwanda
-
 Saudi Arabia
-
 Serbia
-
 Singapore
-
 Slovakia
-
 Slovenia
-
 Somalia
-
 South Africa
-
 Spain
Spain
-
 Sri Lanka
-
 Sweden
-
 Switzerland
-
 Syria
Syria
-
 Taiwan
-
 Tajikistan
-
 Tanzania
-
 Thailand
-
 Trinidad and Tobago
-
 Tunisia
-
 Turkey
-
 UAE
UAE
-
 Uganda
-
 Ukraine
-
 United Kingdom
-
United States
-
 Uruguay
-
 Uzbekistan
-
 Venezuela
-
 Vietnam
-
 Yemen
Yemen
-
 Zambia
-
 Zimbabwe
- Forex
- Crypto
