
-8.23% for Theta as persistent selling weighs on price

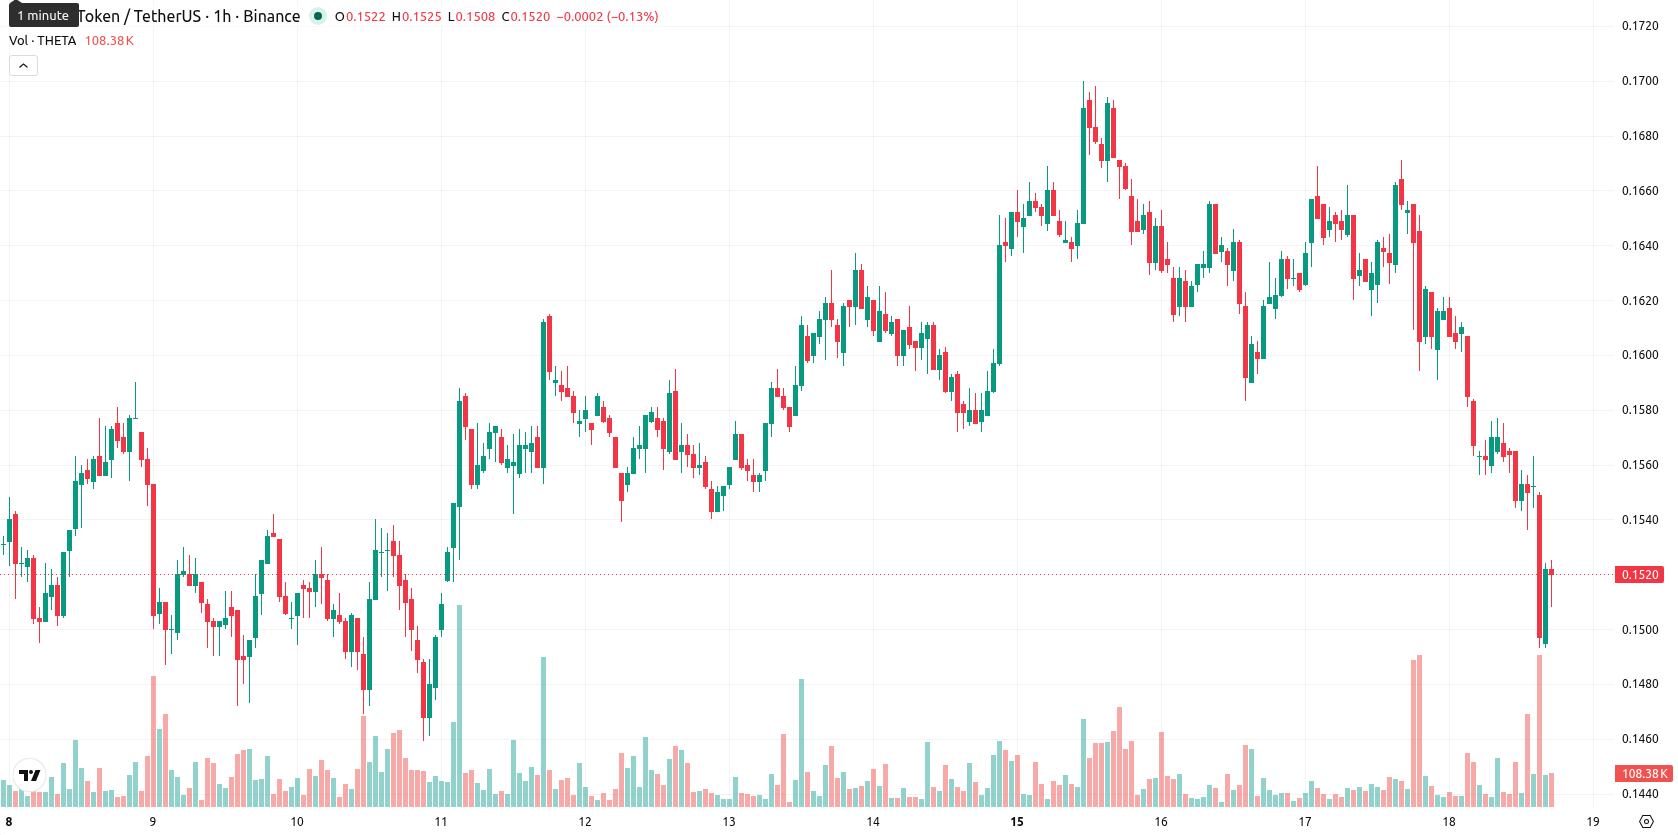
Theta (THETA) is trading at $0.1517, down 8.23% today and near its session low with notable volatility. The asset remains below its key moving averages, indicating continued short-term and medium-term weakness.
Highlights
- Theta trades under key moving averages with persistent downward momentum, reflecting strong selling pressure across multiple timeframes.
- Bearish sentiment dominates as most momentum indicators confirm continued weakness, despite conflicting signals from a few oscillators.
- Theta is likely to remain range-bound between $0.1480999 and $0.1554000 over the next 2–3 days, with elevated risk of further downside if support breaks.
Bearish momentum prevails as multiple indicators signal persistent weakness
On the hourly chart, THETA is trading below the MA-20 ($0.1571000) and MA-50 ($0.1608980), while on the daily timeframe it sits underneath the MA-200 ($0.2247180). The Ichimoku Kijun is set at $0.1582000, acting as immediate resistance. Momentum indicators are decisively bearish: MACD and ADX confirm a sustained downward force, while the RSI stands at 30.40 (Sell), and the CCI is in oversold territory. BBP indicates sellers are controlling intraday dynamics, with the Awesome Oscillator also supporting a negative trend. Notably, the Stoch RSI diverges, showing a strong buy reading against the broader momentum setup.
Sideways range likely as downside risk dominates near-term outlook
Over the next 2–3 trading days, THETA is expected to move within the $0.1480999 to $0.1554000 range, reflecting a typical volatility band relative to current levels. There is a very low probability of an upward move, while the chance of further downside pressure remains high. The baseline forecast calls for sideways action within this corridor, with an upside scenario triggered only by a breakout above $0.1582000 or a bearish extension if support at $0.1480999 fails.
Earlier, analysts noted that Theta was exhibiting bullish momentum amid a shift from bearish conditions, with technical indicators favoring an upside breakout. The current environment, however, signals a pronounced shift to bearish momentum with increasing downside risk, making a close watch on the $0.1480999 support level essential for traders seeking early cues on a potential trend reversal or further declines.


-
 Afghanistan
-
 Albania
-
 Algeria
-
 Angola
-
 Argentina
-
 Armenia
-
 Australia
-
 Austria
-
 Azerbaijan
-
 Bahamas
-
 Bahrain
-
 Bangladesh
-
 Belarus
-
 Belgium
-
 Bolivia
-
 Botswana
-
 Brazil
-
 Brunei
-
 Bulgaria
-
 Cambodia
-
 Cameroon
-
 Canada
-
 Chile
Chile
-
 China
China
-
 Colombia
-
 Congo
Congo
-
 Costa Rica
-
 Cote d'Ivoire
-
 Croatia
-
 Cuba
Cuba
-
 Cyprus
-
 Czechia
-
 DR Congo
-
 Denmark
-
 Dominican Republic
-
 Ecuador
-
 Egypt
Egypt
-
 El Salvador
-
 Estonia
-
 Eswatini
-
 Ethiopia
-
 Finland
-
 France
-
 Georgia
-
 Germany
-
 Ghana
Ghana
-
 Greece
-
 Haiti
Haiti
-
 Hong Kong
-
 Hungary
-
 India
India
-
 Indonesia
-
 Iran, Islamic republic
-
 Iraq
Iraq
-
 Ireland
-
 Israel
-
 Italy
Italy
-
 Jamaica
-
 Japan
Japan
-
 Jordan
-
 Kazakhstan
-
 Kenya
Kenya
-
 Korea
Korea
-
 Kuwait
-
 Kyrgyzstan
-
 Laos
Laos
-
 Latvia
-
 Lebanon
-
 Lesotho
-
 Libya
Libya
-
 Lithuania
-
 Luxembourg
-
 Madagascar
-
 Malaysia
-
 Malta
Malta
-
 Mauritius
-
 Mexico
-
 Moldova
-
 Mongolia
-
 Montenegro
-
 Morocco
-
 Mozambique
-
 Myanmar
-
 Namibia
-
 Nepal
Nepal
-
 Netherlands
-
 New Zealand
-
 Nigeria
-
 North Macedonia
-
 Norway
-
 Oman
Oman
-
 Pakistan
-
 Palestine
-
 Panama
-
 Papua New Guinea
-
 Paraguay
-
 Peru
Peru
-
 Philippines
-
 Poland
-
 Portugal
-
 Puerto Rico
-
 Qatar
Qatar
-
 Reunion
-
 Romania
-
 Rwanda
-
 Saudi Arabia
-
 Serbia
-
 Singapore
-
 Slovakia
-
 Slovenia
-
 Somalia
-
 South Africa
-
 Spain
Spain
-
 Sri Lanka
-
 Sweden
-
 Switzerland
-
 Syria
Syria
-
 Taiwan
-
 Tajikistan
-
 Tanzania
-
 Thailand
-
 Trinidad and Tobago
-
 Tunisia
-
 Turkey
-
 UAE
UAE
-
 Uganda
-
 Ukraine
-
 United Kingdom
-
United States
-
 Uruguay
-
 Uzbekistan
-
 Venezuela
-
 Vietnam
-
 Yemen
Yemen
-
 Zambia
-
 Zimbabwe
- Forex
- Crypto
