
+6.45% for Theta as daily volatility intensifies price swings

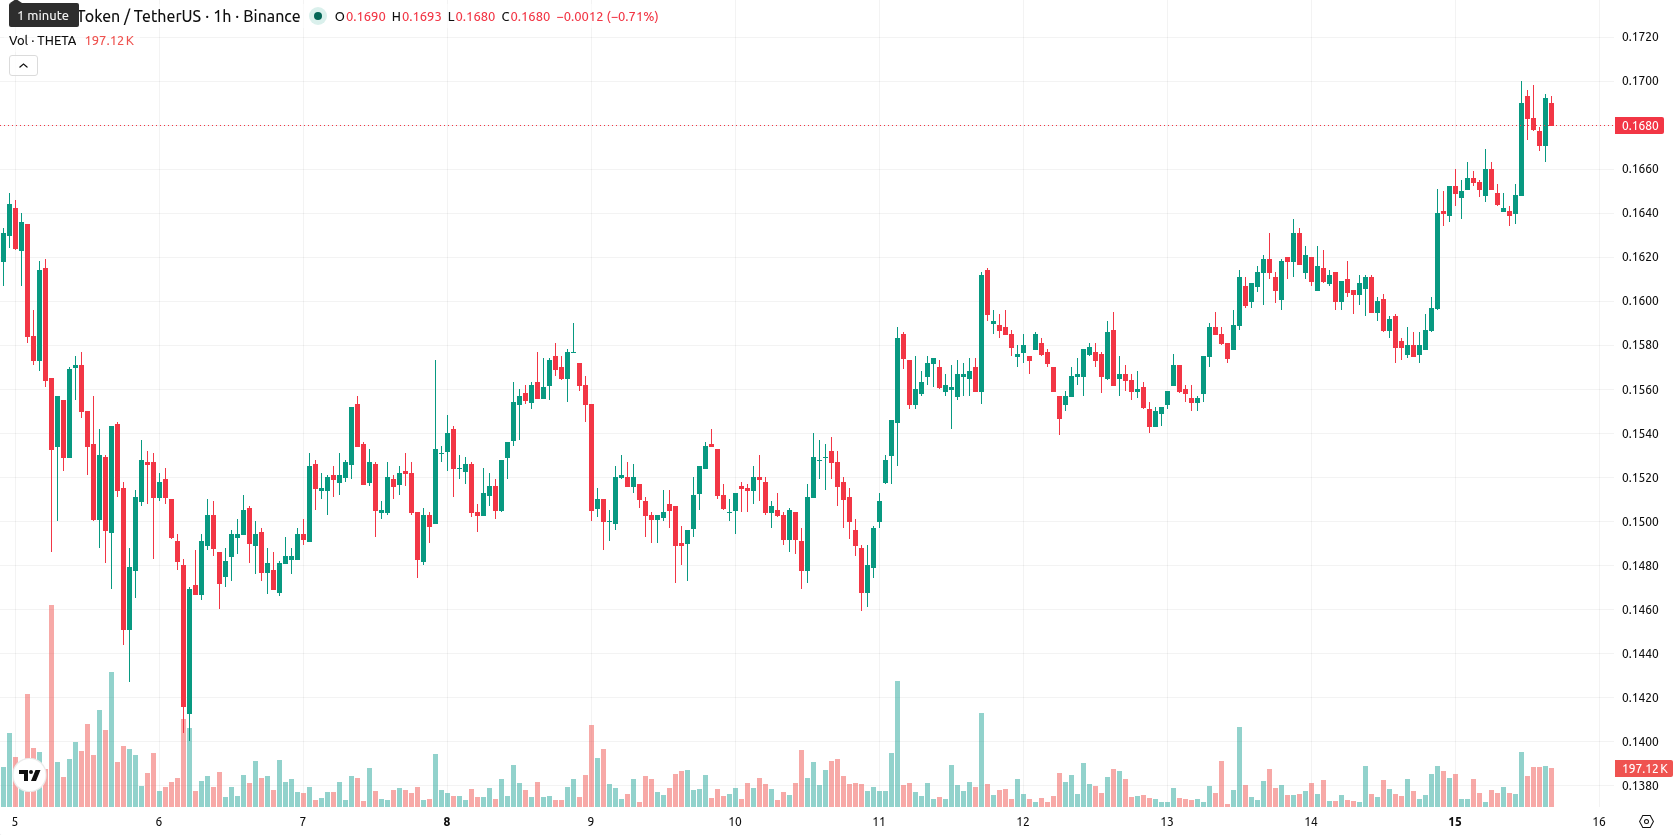
Theta (THETA) is trading at $0.1684, up 6.45% on the day. The current price stands above its key short- and medium-term moving averages but remains beneath long-term average levels.
Highlights
- THETA/USD displays strong short- and medium-term bullish momentum while remaining under a bearish long-term structure.
- Momentum indicators signal robust buying activity, but technicals approach overbought territory amid heightened volatility.
- Price is expected to consolidate between $0.1641 and $0.1727 over the next 2–3 days, with a high probability of further upside.
Buyer momentum persists as technical indicators flag overbought risk
The MA-20 is located at $0.1653750 and the MA-50 at $0.1623460, both below the current price, while the MA-200 remains above at $0.2276505. The Ichimoku Kijun immediate support level is set at $0.1636000. RSI is elevated at 65.43, and momentum indicators including MACD, ADX, Stoch RSI, and CCI are all reporting in Buy territory. BBP readings are positive, indicating persistent buyer dominance intraday, and the Awesome Oscillator confirms the prevailing upward trend. Price action today is close to the session high, with high volatility amplifying momentum readings.
Upside breakout favored as volatility bands guide near-term range
Over the next 2–3 trading days, Theta is expected to fluctuate within a volatility band of $0.1640844 to $0.1727156. The probability of a further upside move is assessed as very high, while downside likelihood remains low. In the baseline case, price should consolidate between current support and resistance levels; a bullish scenario could see a breakout above resistance towards the upper range, while a bearish scenario would require a confirmed loss of immediate support.
Earlier, analysts noted that Theta was displaying growing optimism as momentum began to shift from bearish to bullish conditions. The latest surge in both price and indicator signals now accentuates the upward bias, making a breakout above short-term resistance an important catalyst to monitor for renewed bullish momentum.


-
 Afghanistan
-
 Albania
-
 Algeria
-
 Angola
-
 Argentina
-
 Armenia
-
 Australia
-
 Austria
-
 Azerbaijan
-
 Bahamas
-
 Bahrain
-
 Bangladesh
-
 Belarus
-
 Belgium
-
 Bolivia
-
 Botswana
-
 Brazil
-
 Brunei
-
 Bulgaria
-
 Cambodia
-
 Cameroon
-
 Canada
-
 Chile
Chile
-
 China
China
-
 Colombia
-
 Congo
Congo
-
 Costa Rica
-
 Cote d'Ivoire
-
 Croatia
-
 Cuba
Cuba
-
 Cyprus
-
 Czechia
-
 DR Congo
-
 Denmark
-
 Dominican Republic
-
 Ecuador
-
 Egypt
Egypt
-
 El Salvador
-
 Estonia
-
 Eswatini
-
 Ethiopia
-
 Finland
-
 France
-
 Georgia
-
 Germany
-
 Ghana
Ghana
-
 Greece
-
 Haiti
Haiti
-
 Hong Kong
-
 Hungary
-
 India
India
-
 Indonesia
-
 Iran, Islamic republic
-
 Iraq
Iraq
-
 Ireland
-
 Israel
-
 Italy
Italy
-
 Jamaica
-
 Japan
Japan
-
 Jordan
-
 Kazakhstan
-
 Kenya
Kenya
-
 Korea
Korea
-
 Kuwait
-
 Kyrgyzstan
-
 Laos
Laos
-
 Latvia
-
 Lebanon
-
 Lesotho
-
 Libya
Libya
-
 Lithuania
-
 Luxembourg
-
 Madagascar
-
 Malaysia
-
 Malta
Malta
-
 Mauritius
-
 Mexico
-
 Moldova
-
 Mongolia
-
 Montenegro
-
 Morocco
-
 Mozambique
-
 Myanmar
-
 Namibia
-
 Nepal
Nepal
-
 Netherlands
-
 New Zealand
-
 Nigeria
-
 North Macedonia
-
 Norway
-
 Oman
Oman
-
 Pakistan
-
 Palestine
-
 Panama
-
 Papua New Guinea
-
 Paraguay
-
 Peru
Peru
-
 Philippines
-
 Poland
-
 Portugal
-
 Puerto Rico
-
 Qatar
Qatar
-
 Reunion
-
 Romania
-
 Rwanda
-
 Saudi Arabia
-
 Serbia
-
 Singapore
-
 Slovakia
-
 Slovenia
-
 Somalia
-
 South Africa
-
 Spain
Spain
-
 Sri Lanka
-
 Sweden
-
 Switzerland
-
 Syria
Syria
-
 Taiwan
-
 Tajikistan
-
 Tanzania
-
 Thailand
-
 Trinidad and Tobago
-
 Tunisia
-
 Turkey
-
 UAE
UAE
-
 Uganda
-
 Ukraine
-
 United Kingdom
-
United States
-
 Uruguay
-
 Uzbekistan
-
 Venezuela
-
 Vietnam
-
 Yemen
Yemen
-
 Zambia
-
 Zimbabwe
- Forex
- Crypto
