
VET shows mixed momentum amid consolidation beneath key moving averages: weekly report

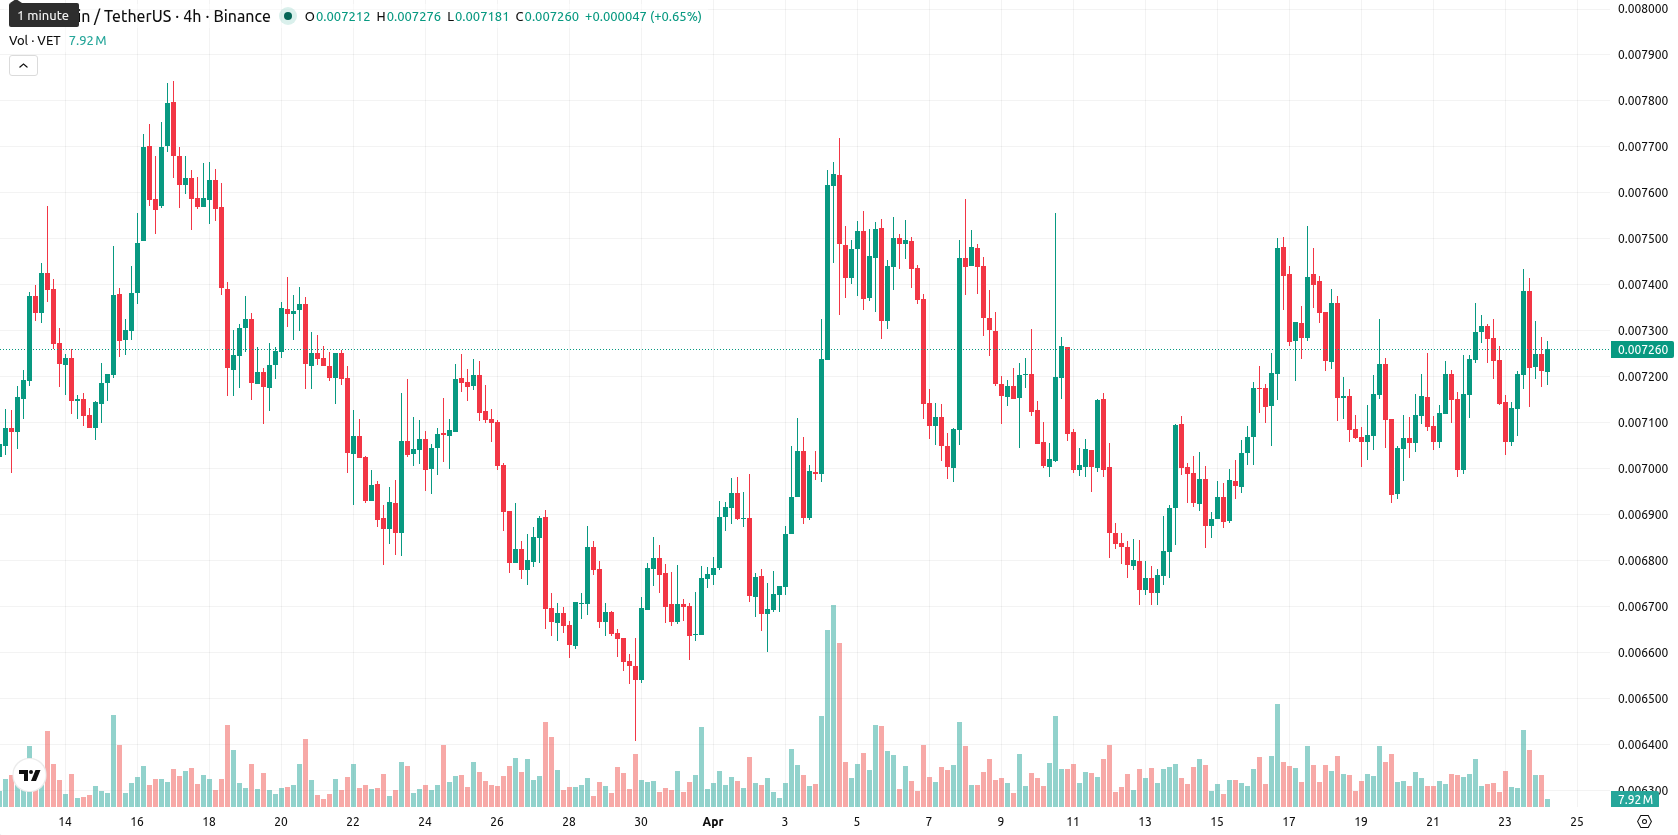
VeChain (VET) is trading at $0.007271, concluding the week with a marginal gain of $0.000028 (0.41%). The asset remains positioned below its weekly MA-20 ($0.00862785), MA-50 ($0.01646174), and MA-200 ($0.02436209), signaling ongoing downward pressure and a bearish technical structure on the weekly timeframe.
Highlights
- VeChain (VET) maintains a bearish structure, trading below major moving averages in both medium- and long-term timeframes.
- Weekly momentum and trend indicators signal sustained selling, with bears dominating and minimal upside probability below 20%.
- VET is expected to consolidate between $0.00675 and $0.00775 over the next week, with a breakdown risking new local lows.
Bearish bias persists as indicators signal strong downside momentum over week
Technical analysis on the weekly chart indicates that VET is sustaining a bearish bias, with price consolidating below all key moving averages. The nearest dynamic resistance is the MA-20, while more distant resistance lies at MA-50 and MA-200. Weekly indicators reinforce this outlook: the RSI is weak at 33.48, MACD remains in strong sell mode, ADX is elevated at 30.09 showing strong downside momentum, and CCI stays in sell territory. The Stochastic RSI flags overbought conditions, reflecting a technical divergence within the negative overall structure, while Bull/Bear Power exposes continued seller dominance. The Awesome Oscillator stays neutral, confirming a muted tone. Weekly volatility reached 7.35% as VET held in the upper range after prior declines.
Sideways range favored as weak technicals limit upside in coming week
For the next seven days, VET is expected to fluctuate between $0.00675 and $0.00775, with sideways movement remaining the baseline scenario. Based on weekly indicators, the probability of a sustained upside is very low (less than 20%), as none of the key technical tools currently support a bullish reversal. A breakout above $0.00775 would target the weekly MA-20, while a break below $0.00675 may trigger further losses and establish new local lows. Overall, the asset is set to trade within a restricted range, maintaining the consolidation phase under bearish influence.
Earlier, analysts noted that VeChain was experiencing persistent bearish technical momentum and lacked evidence of an imminent bullish reversal. The current analysis strengthens this outlook with fresh indicator readings and highlights that traders should remain cautious for potential volatility around the lower end of the consolidation range.


-
 Afghanistan
-
 Albania
-
 Algeria
-
 Angola
-
 Argentina
-
 Armenia
-
 Australia
-
 Austria
-
 Azerbaijan
-
 Bahamas
-
 Bahrain
-
 Bangladesh
-
 Belarus
-
 Belgium
-
 Bolivia
-
 Botswana
-
 Brazil
-
 Brunei
-
 Bulgaria
-
 Cambodia
-
 Cameroon
-
 Canada
-
 Chile
Chile
-
 China
China
-
 Colombia
-
 Congo
Congo
-
 Costa Rica
-
 Cote d'Ivoire
-
 Croatia
-
 Cuba
Cuba
-
 Cyprus
-
 Czechia
-
 DR Congo
-
 Denmark
-
 Dominican Republic
-
 Ecuador
-
 Egypt
Egypt
-
 El Salvador
-
 Estonia
-
 Eswatini
-
 Ethiopia
-
 Finland
-
 France
-
 Georgia
-
 Germany
-
 Ghana
Ghana
-
 Greece
-
 Haiti
Haiti
-
 Hong Kong
-
 Hungary
-
 India
India
-
 Indonesia
-
 Iran, Islamic republic
-
 Iraq
Iraq
-
 Ireland
-
 Israel
-
 Italy
Italy
-
 Jamaica
-
 Japan
Japan
-
 Jordan
-
 Kazakhstan
-
 Kenya
Kenya
-
 Korea
Korea
-
 Kuwait
-
 Kyrgyzstan
-
 Laos
Laos
-
 Latvia
-
 Lebanon
-
 Lesotho
-
 Libya
Libya
-
 Lithuania
-
 Luxembourg
-
 Madagascar
-
 Malaysia
-
 Malta
Malta
-
 Mauritius
-
 Mexico
-
 Moldova
-
 Mongolia
-
 Montenegro
-
 Morocco
-
 Mozambique
-
 Myanmar
-
 Namibia
-
 Nepal
Nepal
-
 Netherlands
-
 New Zealand
-
 Nigeria
-
 North Macedonia
-
 Norway
-
 Oman
Oman
-
 Pakistan
-
 Palestine
-
 Panama
-
 Papua New Guinea
-
 Paraguay
-
 Peru
Peru
-
 Philippines
-
 Poland
-
 Portugal
-
 Puerto Rico
-
 Qatar
Qatar
-
 Reunion
-
 Romania
-
 Rwanda
-
 Saudi Arabia
-
 Serbia
-
 Singapore
-
 Slovakia
-
 Slovenia
-
 Somalia
-
 South Africa
-
 Spain
Spain
-
 Sri Lanka
-
 Sweden
-
 Switzerland
-
 Syria
Syria
-
 Taiwan
-
 Tajikistan
-
 Tanzania
-
 Thailand
-
 Trinidad and Tobago
-
 Tunisia
-
 Turkey
-
 UAE
UAE
-
 Uganda
-
 Ukraine
-
 United Kingdom
-
United States
-
 Uruguay
-
 Uzbekistan
-
 Venezuela
-
 Vietnam
-
 Yemen
Yemen
-
 Zambia
-
 Zimbabwe
- Forex
- Crypto
