
Starknet consolidates as price holds above immediate support level

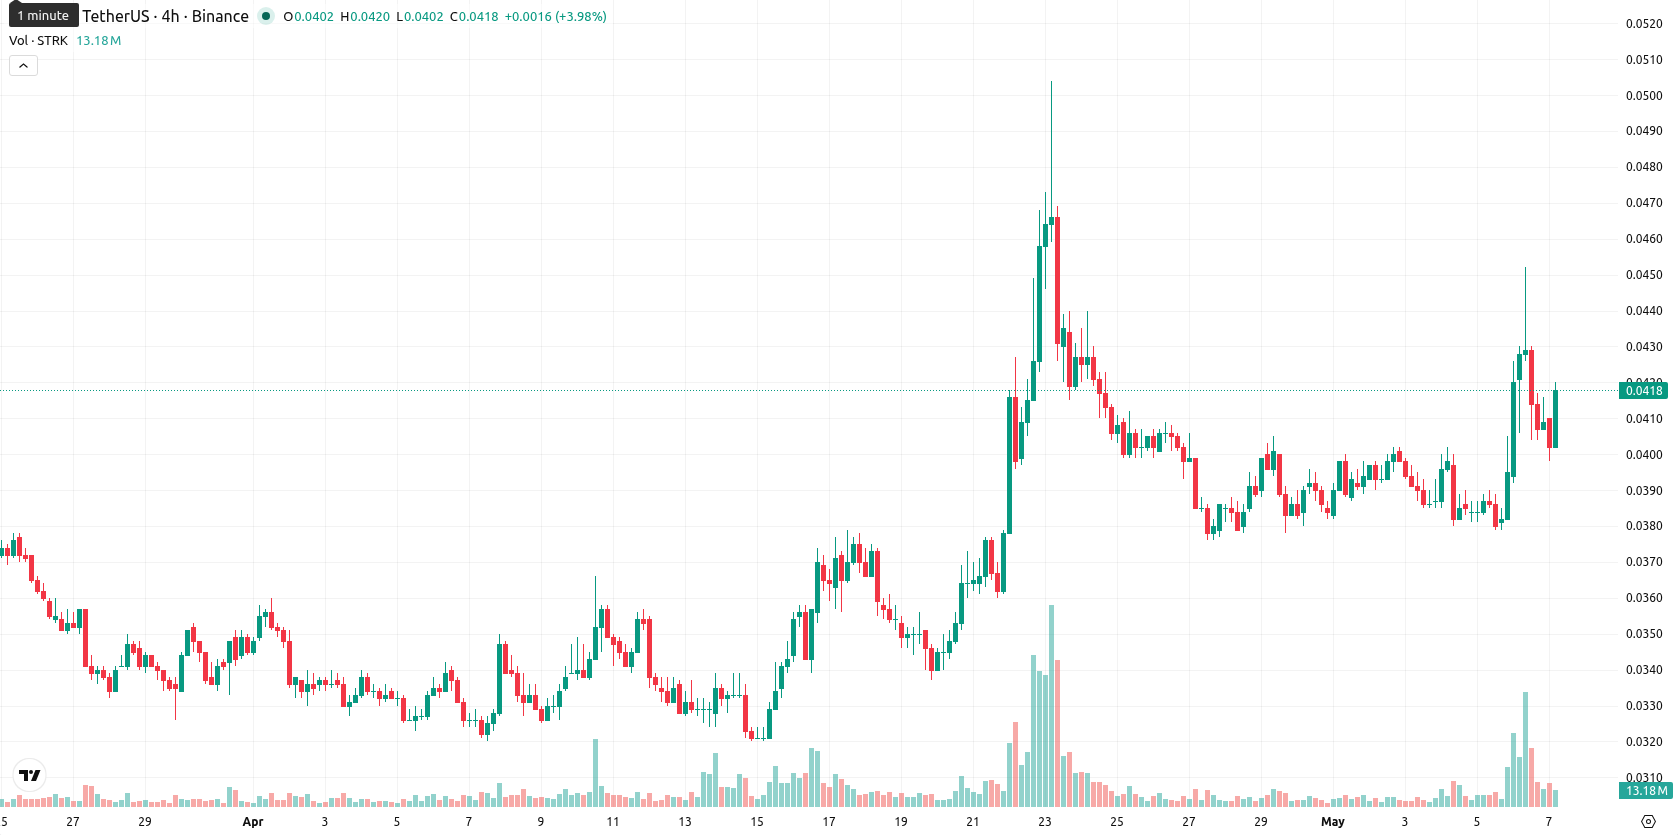
Starknet (STRK) is trading at $0.0418, showing a daily gain of 0.24%. The asset is currently positioned above its key short- and medium-term moving averages but remains below its longer-term trend markers.
Highlights
- Short- and medium-term momentum for STRK remains bullish, but the long-term trend faces significant resistance overhead.
- Technical indicators confirm upside strength for the near term, with positive signals from multiple momentum measures and no overbought warnings.
- For the week ahead, expect STRK to trade in a narrow $0.0409–$0.0418 range, with a greater probability of sideways consolidation or a potential decline if support breaks.
Bullish momentum sustains as price approaches session highs
On the technical front, STRK is trading above the SMA-20 at $0.0391 and the SMA-50 at $0.0364, while remaining well below the SMA-200 at $0.0771. The Ichimoku Kijun level is positioned at $0.0412, serving as immediate support below the current price. Momentum indicators on the daily chart are constructive: the MACD signals "Strong Buy", the ADX confirms current trend strength, and the RSI sits in bullish territory at 58. The CCI is positive but not overbought, and the Stoch RSI is neutral, with no risk of overextension according to main oscillators. BBP is positive, indicating buyer dominance, while the Awesome Oscillator is neutral and does not reinforce the upward move. The price is near today’s session highs of $0.0419, with modest volatility and an intraday bias toward continued strength.
Range-bound outlook persists as broader trends cap upside
Over the coming week, STRK is expected to trade within a typical volatility band between $0.0409 and $0.0418, clustered near current levels. There is a low probability (below 20%) of a further price increase from here, as broader weekly momentum indicators skew bearish and weekly moving averages continue to indicate selling pressure. The baseline scenario calls for consolidation within a narrow sideways range. Upside would require a close above $0.0418 to unlock further gains, while a decisive drop below $0.0409 would expose the asset to deeper downside risk.
Earlier, analysts noted that Starknet's short-term momentum was improving while longer-term resistance remained an obstacle for sustained upside. The latest technical signals reinforce this mixed outlook, with near-term consolidation likely and a close above current session highs needed to shift the asset’s trajectory in the week ahead.


Latest Starknet News


-
 Afghanistan
-
 Albania
-
 Algeria
-
 Angola
-
 Argentina
-
 Armenia
-
 Australia
-
 Austria
-
 Azerbaijan
-
 Bahamas
-
 Bahrain
-
 Bangladesh
-
 Belarus
-
 Belgium
-
 Bolivia
-
 Botswana
-
 Brazil
-
 Brunei
-
 Bulgaria
-
 Cambodia
-
 Cameroon
-
 Canada
-
 Chile
Chile
-
 China
China
-
 Colombia
-
 Congo
Congo
-
 Costa Rica
-
 Cote d'Ivoire
-
 Croatia
-
 Cuba
Cuba
-
 Cyprus
-
 Czechia
-
 DR Congo
-
 Denmark
-
 Dominican Republic
-
 Ecuador
-
 Egypt
Egypt
-
 El Salvador
-
 Estonia
-
 Eswatini
-
 Ethiopia
-
 Finland
-
 France
-
 Georgia
-
 Germany
-
 Ghana
Ghana
-
 Greece
-
 Haiti
Haiti
-
 Hong Kong
-
 Hungary
-
 India
India
-
 Indonesia
-
 Iran, Islamic republic
-
 Iraq
Iraq
-
 Ireland
-
 Israel
-
 Italy
Italy
-
 Jamaica
-
 Japan
Japan
-
 Jordan
-
 Kazakhstan
-
 Kenya
Kenya
-
 Korea
Korea
-
 Kuwait
-
 Kyrgyzstan
-
 Laos
Laos
-
 Latvia
-
 Lebanon
-
 Lesotho
-
 Libya
Libya
-
 Lithuania
-
 Luxembourg
-
 Madagascar
-
 Malaysia
-
 Malta
Malta
-
 Mauritius
-
 Mexico
-
 Moldova
-
 Mongolia
-
 Montenegro
-
 Morocco
-
 Mozambique
-
 Myanmar
-
 Namibia
-
 Nepal
Nepal
-
 Netherlands
-
 New Zealand
-
 Nigeria
-
 North Macedonia
-
 Norway
-
 Oman
Oman
-
 Pakistan
-
 Palestine
-
 Panama
-
 Papua New Guinea
-
 Paraguay
-
 Peru
Peru
-
 Philippines
-
 Poland
-
 Portugal
-
 Puerto Rico
-
 Qatar
Qatar
-
 Reunion
-
 Romania
-
 Rwanda
-
 Saudi Arabia
-
 Serbia
-
 Singapore
-
 Slovakia
-
 Slovenia
-
 Somalia
-
 South Africa
-
 Spain
Spain
-
 Sri Lanka
-
 Sweden
-
 Switzerland
-
 Syria
Syria
-
 Taiwan
-
 Tajikistan
-
 Tanzania
-
 Thailand
-
 Trinidad and Tobago
-
 Tunisia
-
 Turkey
-
 UAE
UAE
-
 Uganda
-
 Ukraine
-
 United Kingdom
-
United States
-
 Uruguay
-
 Uzbekistan
-
 Venezuela
-
 Vietnam
-
 Yemen
Yemen
-
 Zambia
-
 Zimbabwe
- Forex
- Crypto
