
Jito down nearly 10% as overbought rally fades from session highs

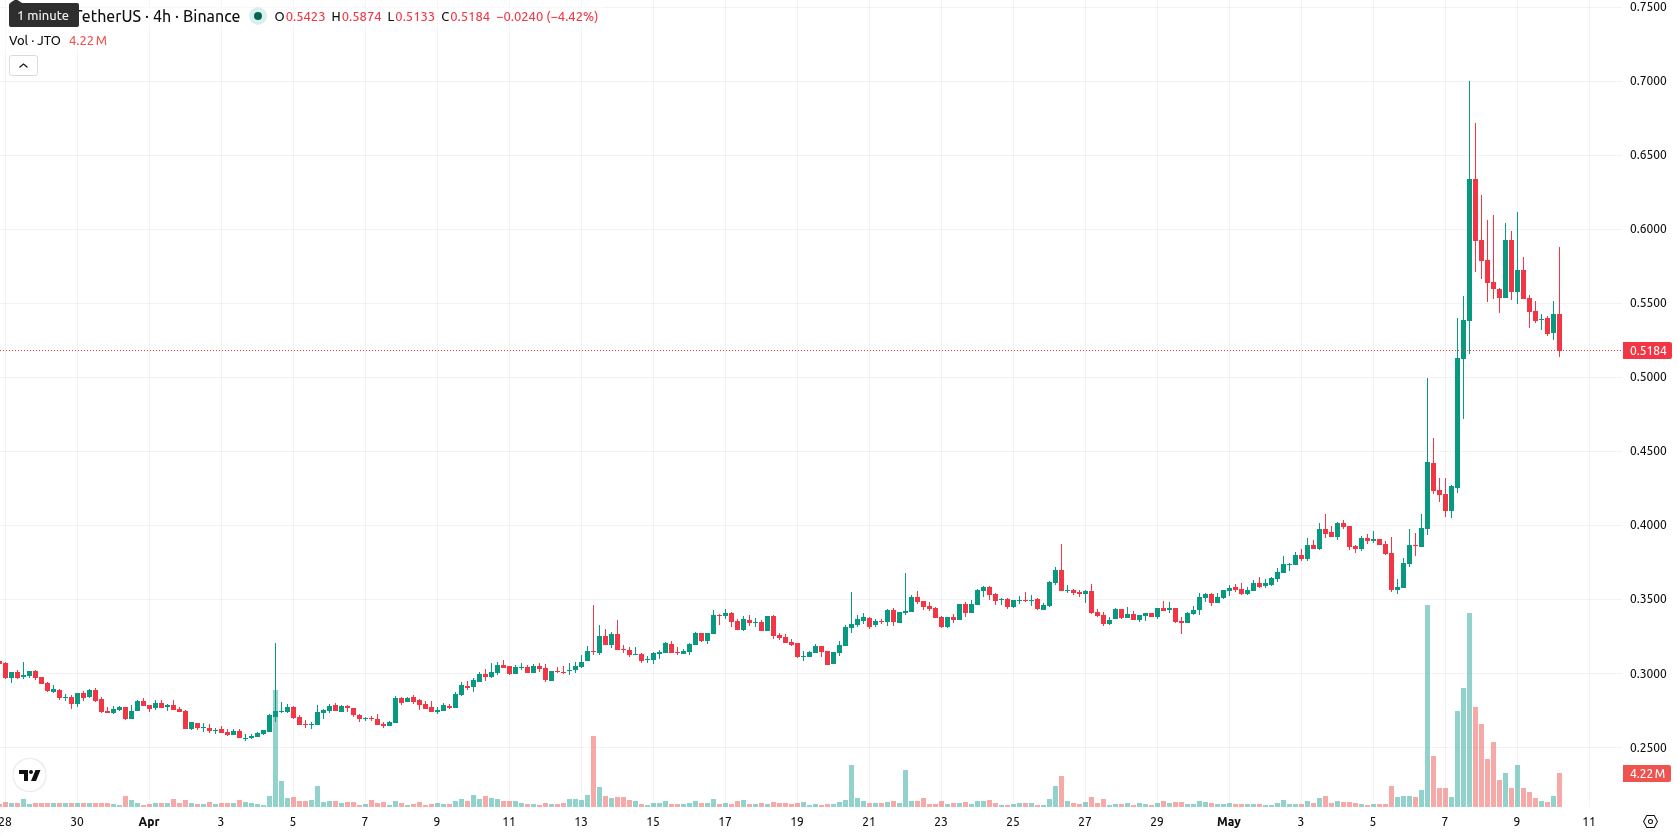
Jito (JTO) is trading at $0.5159, down 9.25% on the day and currently positioned well above its key moving averages. The price remains above short-, medium-, and long-term averages, despite notable intraday volatility.
Highlights
- JTO remains structurally bullish across short, medium, and long timeframes, trading well above key trend averages.
- Despite strong trend signals, overbought conditions and a sharp intraday reversal raise significant risk of near-term correction.
- Weekly range projected between $0.4700 and $0.5700, with downside more probable unless $0.5700 is decisively breached.
Overbought signals intensify as trend strength remains robust
On the technical front, JTO is currently well above its SMA-20 at $0.3894, SMA-50 at $0.3344, and SMA-200 at $0.4224. On the daily chart, the Ichimoku Kijun level stands at $0.5030, providing immediate support beneath current prices. The D1 ADX reading of 45.11 confirms strong trend strength, while the MACD remains in bullish territory. However, both the RSI at 72.72 and CCI at 197.41 signal overbought conditions, which suggests the rally may be overextended. Stoch RSI is neutral, BBP points to continued buyer dominance intraday, and the Awesome Oscillator is supportive of further upside, yet the daily session remains negative with the price near today’s low after a sharp intraday reversal.
Sideways bias prevails as downside risks outweigh breakout odds
Looking to the coming week, JTO is expected to trade within a volatility band between $0.4700 and $0.5700. The probability of an upward move is low, with less than a 20% chance based on current weekly signals, suggesting that a move lower is more likely. The baseline scenario calls for sideways movement within this range, while a sustained break above $0.5700 could open higher targets. Conversely, a failure to hold the $0.4700 support may trigger further downside.
Earlier, analysts noted that Jito was exhibiting robust bullish momentum supported by rising DeFi revenues and strong governance demand, while cautioning that persistent volatility and overbought signals could complicate the outlook. The current retracement, with the price holding above key moving averages but facing declining momentum, suggests traders should closely monitor the $0.4700 support as a potential trigger for further downside risk in the days ahead.


Latest Jito News


-
 Afghanistan
-
 Albania
-
 Algeria
-
 Angola
-
 Argentina
-
 Armenia
-
 Australia
-
 Austria
-
 Azerbaijan
-
 Bahamas
-
 Bahrain
-
 Bangladesh
-
 Belarus
-
 Belgium
-
 Bolivia
-
 Botswana
-
 Brazil
-
 Brunei
-
 Bulgaria
-
 Cambodia
-
 Cameroon
-
 Canada
-
 Chile
Chile
-
 China
China
-
 Colombia
-
 Congo
Congo
-
 Costa Rica
-
 Cote d'Ivoire
-
 Croatia
-
 Cuba
Cuba
-
 Cyprus
-
 Czechia
-
 DR Congo
-
 Denmark
-
 Dominican Republic
-
 Ecuador
-
 Egypt
Egypt
-
 El Salvador
-
 Estonia
-
 Eswatini
-
 Ethiopia
-
 Finland
-
 France
-
 Georgia
-
 Germany
-
 Ghana
Ghana
-
 Greece
-
 Haiti
Haiti
-
 Hong Kong
-
 Hungary
-
 India
India
-
 Indonesia
-
 Iran, Islamic republic
-
 Iraq
Iraq
-
 Ireland
-
 Israel
-
 Italy
Italy
-
 Jamaica
-
 Japan
Japan
-
 Jordan
-
 Kazakhstan
-
 Kenya
Kenya
-
 Korea
Korea
-
 Kuwait
-
 Kyrgyzstan
-
 Laos
Laos
-
 Latvia
-
 Lebanon
-
 Lesotho
-
 Libya
Libya
-
 Lithuania
-
 Luxembourg
-
 Madagascar
-
 Malaysia
-
 Malta
Malta
-
 Mauritius
-
 Mexico
-
 Moldova
-
 Mongolia
-
 Montenegro
-
 Morocco
-
 Mozambique
-
 Myanmar
-
 Namibia
-
 Nepal
Nepal
-
 Netherlands
-
 New Zealand
-
 Nigeria
-
 North Macedonia
-
 Norway
-
 Oman
Oman
-
 Pakistan
-
 Palestine
-
 Panama
-
 Papua New Guinea
-
 Paraguay
-
 Peru
Peru
-
 Philippines
-
 Poland
-
 Portugal
-
 Puerto Rico
-
 Qatar
Qatar
-
 Reunion
-
 Romania
-
 Rwanda
-
 Saudi Arabia
-
 Serbia
-
 Singapore
-
 Slovakia
-
 Slovenia
-
 Somalia
-
 South Africa
-
 Spain
Spain
-
 Sri Lanka
-
 Sweden
-
 Switzerland
-
 Syria
Syria
-
 Taiwan
-
 Tajikistan
-
 Tanzania
-
 Thailand
-
 Trinidad and Tobago
-
 Tunisia
-
 Turkey
-
 UAE
UAE
-
 Uganda
-
 Ukraine
-
 United Kingdom
-
United States
-
 Uruguay
-
 Uzbekistan
-
 Venezuela
-
 Vietnam
-
 Yemen
Yemen
-
 Zambia
-
 Zimbabwe
- Forex
- Crypto
