
Theta price prediction: Will $0.218 support hold? THETA loses 8.64%

Theta (THETA) is currently trading at $0.222, marking a daily decline of 8.64%. The price sits above its key moving averages on the short and medium timeframes, while remaining below the longer-term averages.
 0.1403
0.1522000
0.1403
0.1522000
Highlights
- Theta expanded its EdgeCloud academic network to 34 global universities as City St George’s, University of London joins, strengthening research partnerships.
- The Theta platform's decentralized structure, governed by its token and enterprise validators like Google and Binance, remains under persistent selling pressure.
- THETA trades near $0.222 with mixed technical signals, an expected five-day range of $0.210–$0.235, and a downside bias as bearish momentum dominates.
Academic network expansion as token faces ongoing sell pressure
Theta announced that City St George’s, University of London joined its EdgeCloud academic network, marking the 34th university partnership globally and the second in the United Kingdom. This collaboration brings additional research activity to Theta’s infrastructure, with Dr. Ferheen Ayaz set to utilize EdgeCloud resources for work in edge artificial intelligence. The Theta token remains central to the platform’s operation and governance, supported by enterprise validators such as Google, Binance, Sony Europe, and Samsung alongside its distributed Guardian node network, though price action has remained under broader selling pressure.
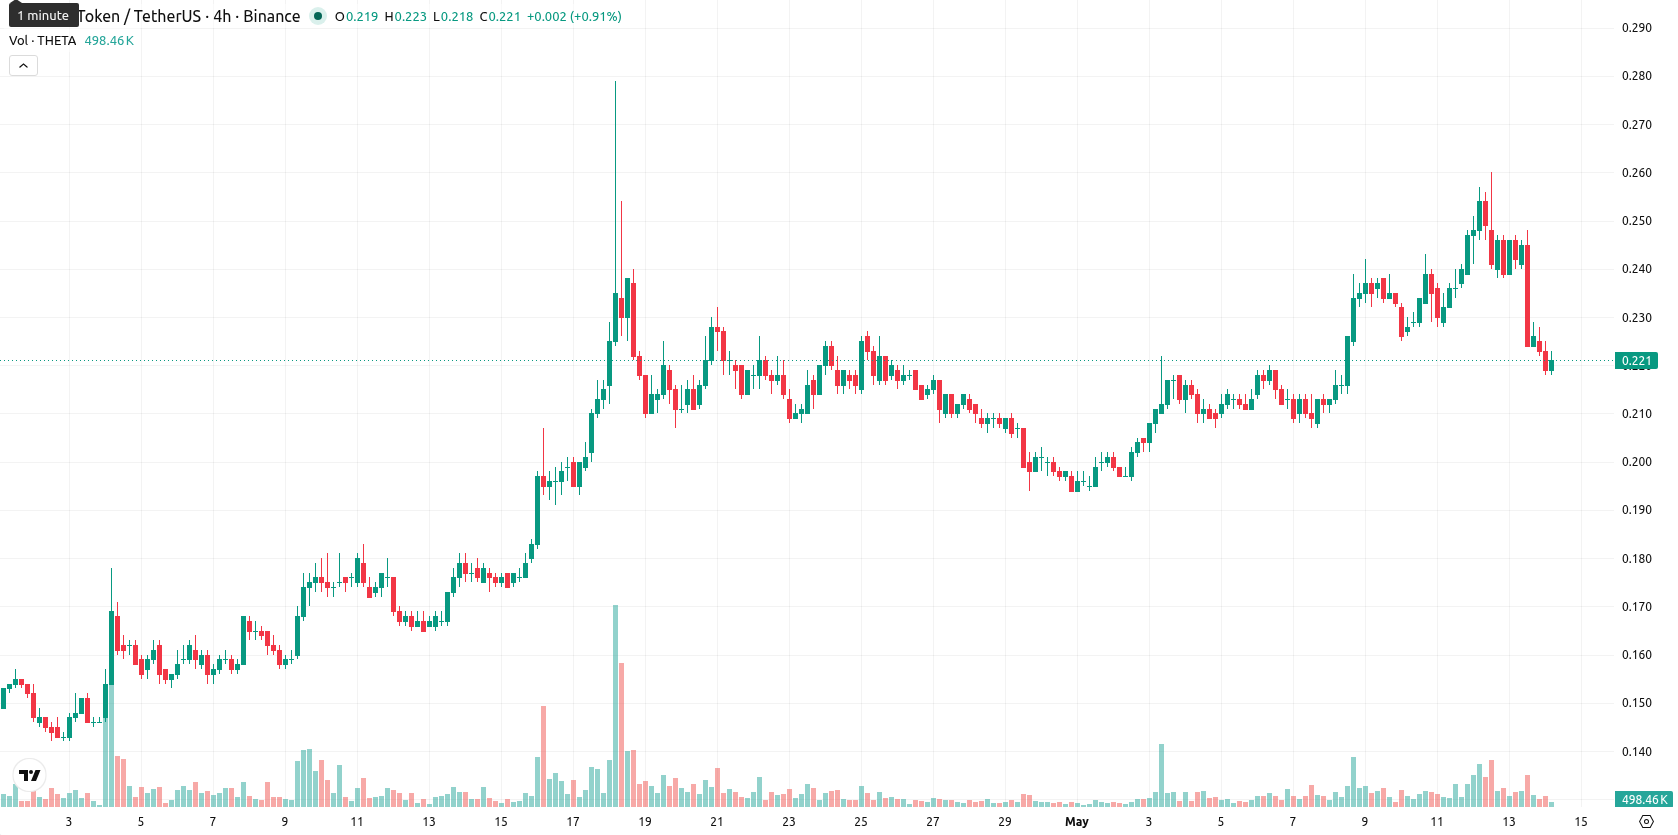
Mixed bull momentum as price tests resistance and oscillators diverge
The price is just above the SMA-20 at $0.2173 and well above the SMA-50 at $0.19232, but it remains below the SMA-200 at $0.26899. The Ichimoku Kijun level at $0.2365 forms immediate resistance, while today's low at $0.218 establishes a key support level. Technical indicators show mixed momentum: MACD and ADX on the daily chart support upward momentum, but the price is currently near the session's low. The RSI indicates ongoing buying interest, Stoch RSI is neutral, and CCI is near bullish territory. Bull/Bear Power (BBP) suggests buyers retain some dominance, Awesome Oscillator points to an underlying bullish bias, while high intraday volatility and diverging oscillator signals underscore current market uncertainty.
Downside risk prevails as volatility persists and indicators turn bearish
Typical volatility for the next five trading days is expected within a band of $0.210 to $0.235, reflecting persistent price pressure and recent price swings. The probability of a price increase is very low (less than 20%), with downside risk prevailing due to weekly RSI, ADX, MACD, and moving averages indicating bearish conditions. The baseline scenario sees the price holding sideways within this corridor. A bullish case requires a move above the $0.2365 resistance, while a bearish scenario emerges if $0.218 is breached, leading to further downside risk.
Earlier, analysts noted that Theta was exhibiting short- and medium-term bullish momentum but cautioned that overbought signals and volatility posed risks of consolidation or retracement. The latest developments indicate an increased likelihood of further downside, so traders should monitor for a sustained break below the $0.218 support as a signal of deeper correction risk.














-
 Afghanistan
-
 Albania
-
 Algeria
-
 Angola
-
 Argentina
-
 Armenia
-
 Australia
-
 Austria
-
 Azerbaijan
-
 Bahamas
-
 Bahrain
-
 Bangladesh
-
 Belarus
-
 Belgium
-
 Bolivia
-
 Botswana
-
 Brazil
-
 Brunei
-
 Bulgaria
-
 Cambodia
-
 Cameroon
-
 Canada
-
 Chile
Chile
-
 China
China
-
 Colombia
-
 Congo
Congo
-
 Costa Rica
-
 Cote d'Ivoire
-
 Croatia
-
 Cuba
Cuba
-
 Cyprus
-
 Czechia
-
 DR Congo
-
 Denmark
-
 Dominican Republic
-
 Ecuador
-
 Egypt
Egypt
-
 El Salvador
-
 Estonia
-
 Eswatini
-
 Ethiopia
-
 Finland
-
 France
-
 Georgia
-
 Germany
-
 Ghana
Ghana
-
 Greece
-
 Haiti
Haiti
-
 Hong Kong
-
 Hungary
-
 India
India
-
 Indonesia
-
 Iran, Islamic republic
-
 Iraq
Iraq
-
 Ireland
-
 Israel
-
 Italy
Italy
-
 Jamaica
-
 Japan
Japan
-
 Jordan
-
 Kazakhstan
-
 Kenya
Kenya
-
 Korea
Korea
-
 Kuwait
-
 Kyrgyzstan
-
 Laos
Laos
-
 Latvia
-
 Lebanon
-
 Lesotho
-
 Libya
Libya
-
 Lithuania
-
 Luxembourg
-
 Madagascar
-
 Malaysia
-
 Malta
Malta
-
 Mauritius
-
 Mexico
-
 Moldova
-
 Mongolia
-
 Montenegro
-
 Morocco
-
 Mozambique
-
 Myanmar
-
 Namibia
-
 Nepal
Nepal
-
 Netherlands
-
 New Zealand
-
 Nigeria
-
 North Macedonia
-
 Norway
-
 Oman
Oman
-
 Pakistan
-
 Palestine
-
 Panama
-
 Papua New Guinea
-
 Paraguay
-
 Peru
Peru
-
 Philippines
-
 Poland
-
 Portugal
-
 Puerto Rico
-
 Qatar
Qatar
-
 Reunion
-
 Romania
-
 Rwanda
-
 Saudi Arabia
-
 Serbia
-
 Singapore
-
 Slovakia
-
 Slovenia
-
 Somalia
-
 South Africa
-
 Spain
Spain
-
 Sri Lanka
-
 Sweden
-
 Switzerland
-
 Syria
Syria
-
 Taiwan
-
 Tajikistan
-
 Tanzania
-
 Thailand
-
 Trinidad and Tobago
-
 Tunisia
-
 Turkey
-
 UAE
UAE
-
 Uganda
-
 Ukraine
-
 United Kingdom
-
United States
-
 Uruguay
-
 Uzbekistan
-
 Venezuela
-
 Vietnam
-
 Yemen
Yemen
-
 Zambia
-
 Zimbabwe
- Forex
- Crypto











