
Failed resistance test keeps Optimism under pressure with fresh losses

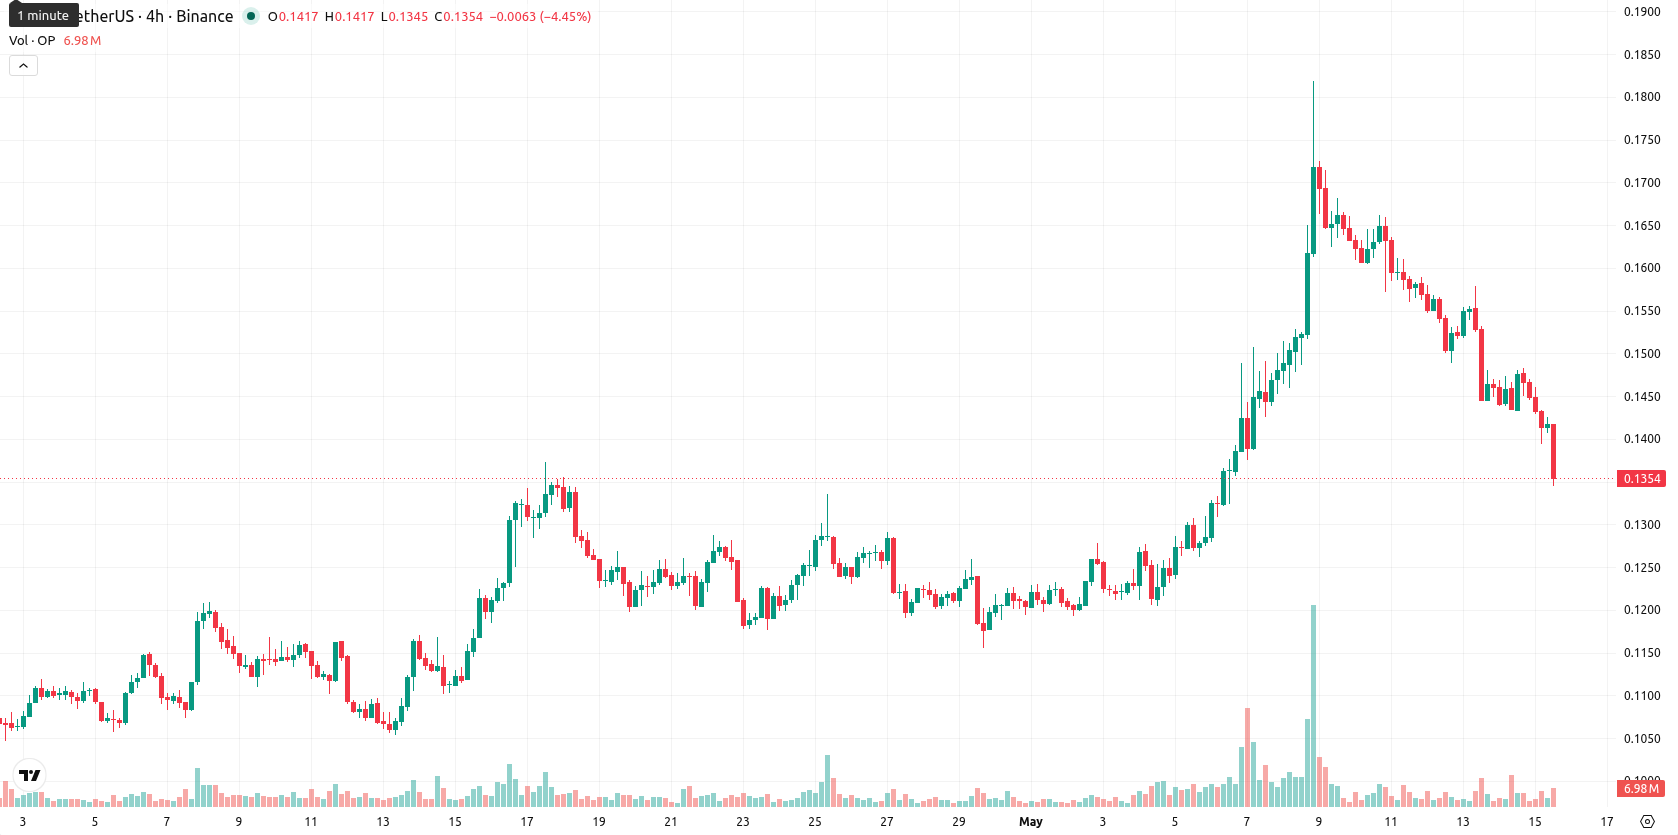
Optimism (OP) is trading at $0.1357, registering a 7.25% decline for the day. The price remains beneath its key moving averages, which highlights short-term downside momentum versus recent averages.
Highlights
- OP demonstrates ongoing short-term bearish pressure, trading below key moving averages and indicating long-term downside risk.
- Momentum indicators present mixed signals, with some buyer interest offset by weak or neutral oscillator readings, highlighting market uncertainty.
- For the next five sessions, OP is expected to trade between $0.125 and $0.150, with a higher probability of declines if support fails.
Mixed technical signals as volatility rises near support-resistance band
OP is currently positioned below the SMA-20 at $0.1373 and well below the SMA-200 at $0.2291, while staying marginally above the SMA-50 at $0.1239. The Ichimoku Kijun at $0.1487 is acting as immediate resistance. On the daily timeframe, momentum indicators show MACD and ADX leaning toward Buy, while the RSI sits at 56.5, indicating mild bullishness. Stoch RSI is neutral near the lower band, CCI is neutral, and BBP gives a Buy signal but with an almost flat value, which reflects minimal buying strength. Price action has shown heightened volatility with the session’s move bringing OP near today’s lows, stressing the divergence between persistent but weak buyer interest and prevailing negative or neutral oscillator levels.
Downside bias as probability of rebound remains low
Over the next five trading days, OP is likely to fluctuate within a typical volatility band of $0.125 to $0.150. The probability of a further upward move is very low (less than 20%), making a decline more likely in the immediate term. Baseline scenario: OP trades within current local support and resistance amid variable, sideways movement. A break above $0.1487 may enable a test of the upper range, while a breakdown below $0.125 could accelerate declines toward earlier lows.
Earlier, analysts noted that Optimism was under sustained bearish momentum, with technical indicators suggesting limited immediate upside potential. The current setup confirms this cautious outlook, and traders should closely monitor the $0.125 support level, as a breakdown could trigger a fresh leg lower in the coming sessions.


Latest Optimism News


-
 Afghanistan
-
 Albania
-
 Algeria
-
 Angola
-
 Argentina
-
 Armenia
-
 Australia
-
 Austria
-
 Azerbaijan
-
 Bahamas
-
 Bahrain
-
 Bangladesh
-
 Belarus
-
 Belgium
-
 Bolivia
-
 Botswana
-
 Brazil
-
 Brunei
-
 Bulgaria
-
 Cambodia
-
 Cameroon
-
 Canada
-
 Chile
Chile
-
 China
China
-
 Colombia
-
 Congo
Congo
-
 Costa Rica
-
 Cote d'Ivoire
-
 Croatia
-
 Cuba
Cuba
-
 Cyprus
-
 Czechia
-
 DR Congo
-
 Denmark
-
 Dominican Republic
-
 Ecuador
-
 Egypt
Egypt
-
 El Salvador
-
 Estonia
-
 Eswatini
-
 Ethiopia
-
 Finland
-
 France
-
 Georgia
-
 Germany
-
 Ghana
Ghana
-
 Greece
-
 Haiti
Haiti
-
 Hong Kong
-
 Hungary
-
 India
India
-
 Indonesia
-
 Iran, Islamic republic
-
 Iraq
Iraq
-
 Ireland
-
 Israel
-
 Italy
Italy
-
 Jamaica
-
 Japan
Japan
-
 Jordan
-
 Kazakhstan
-
 Kenya
Kenya
-
 Korea
Korea
-
 Kuwait
-
 Kyrgyzstan
-
 Laos
Laos
-
 Latvia
-
 Lebanon
-
 Lesotho
-
 Libya
Libya
-
 Lithuania
-
 Luxembourg
-
 Madagascar
-
 Malaysia
-
 Malta
Malta
-
 Mauritius
-
 Mexico
-
 Moldova
-
 Mongolia
-
 Montenegro
-
 Morocco
-
 Mozambique
-
 Myanmar
-
 Namibia
-
 Nepal
Nepal
-
 Netherlands
-
 New Zealand
-
 Nigeria
-
 North Macedonia
-
 Norway
-
 Oman
Oman
-
 Pakistan
-
 Palestine
-
 Panama
-
 Papua New Guinea
-
 Paraguay
-
 Peru
Peru
-
 Philippines
-
 Poland
-
 Portugal
-
 Puerto Rico
-
 Qatar
Qatar
-
 Reunion
-
 Romania
-
 Rwanda
-
 Saudi Arabia
-
 Serbia
-
 Singapore
-
 Slovakia
-
 Slovenia
-
 Somalia
-
 South Africa
-
 Spain
Spain
-
 Sri Lanka
-
 Sweden
-
 Switzerland
-
 Syria
Syria
-
 Taiwan
-
 Tajikistan
-
 Tanzania
-
 Thailand
-
 Trinidad and Tobago
-
 Tunisia
-
 Turkey
-
 UAE
UAE
-
 Uganda
-
 Ukraine
-
 United Kingdom
-
United States
-
 Uruguay
-
 Uzbekistan
-
 Venezuela
-
 Vietnam
-
 Yemen
Yemen
-
 Zambia
-
 Zimbabwe
- Forex
- Crypto
