
Optimism slips with strong sell signals from MACD: weekly outlook

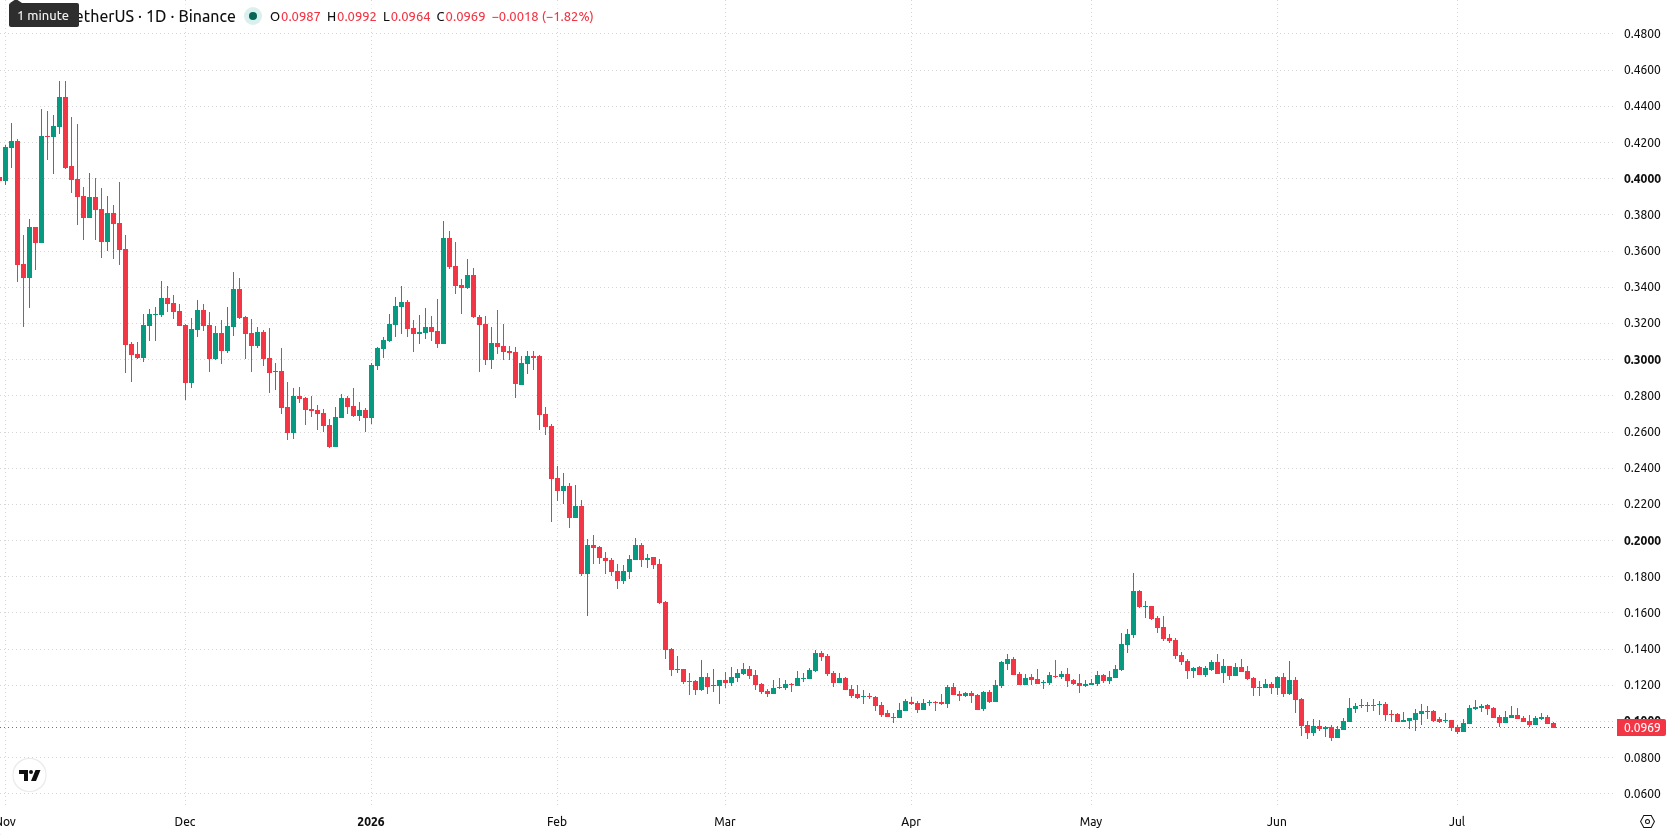
Optimism (OP) is trading at $0.0969, having declined by $0.0088 (8.33%) over the past week and remaining firmly below its weekly MA-20 ($0.1148), MA-50 ($0.3098), and MA-200 ($1,3883). The pronounced gap beneath all major weekly moving averages highlights ongoing downside pressure and reinforces OP's negative medium- and long-term technical trend.
 0.0962
0.1046
0.0962
0.1046
Highlights
- OP remains firmly in a negative trend, trading well below major moving averages with persistent selling pressure dominating.
- Multiple technical indicators—including MACD, ADX, and Bull/Bear Power—confirm a strong bearish momentum with no signs of reversal.
- Anticipated price range for the next week is $0.0875 to $0.1070, with further downside more likely than any upside breakout.
Bearish technical momentum prevails as sellers control weekly chart
On the weekly chart, OP trades significantly below its MA-20, MA-50, and MA-200, with the MA-20 at $0.1148 acting as dynamic resistance. Key support for the week is near $0.0875, with resistance at $0.1070. Weekly momentum-based indicators continue to signal strong bearish conditions: the MACD gives a Strong Sell, ADX is in Sell mode, and the RSI is at 33.88, indicating weak momentum but not yet extreme oversold. The Commodity Channel Index readings remain deeply negative, while the Stochastic RSI appears neutral. Both Bull and Bear Power indicators confirm seller dominance, with volatility for the week at 10.63%.
Downward bias dominates as sideways range and breakout risks persist next week
For the next 7 days, OP is expected to move within a range of $0.0875 — $0.1070, consistent with recent volatility and the persistent downward trend. There is a strong probability of further declines, with less than a 20% chance of a significant upside move as none of the four primary indicators signal Buy. The baseline scenario is for OP to consolidate sideways within its lower corridor. A sustained close above $0.1070 could trigger a short-term relief rally, but current indicators do not support this outcome. In the bearish scenario, a break below $0.0875 would expose OP to new yearly lows and keep selling pressure elevated.
Earlier, analysts noted that Optimism remained entrenched in a bearish trend, with technical indicators reflecting persistent downward pressure. The latest analysis reinforces this negative outlook, highlighting that a sustained drop below $0.0875 would put OP at risk for another leg lower toward new yearly lows.








-
 Afghanistan
-
 Albania
-
 Algeria
-
 Angola
-
 Argentina
-
 Armenia
-
 Australia
-
 Austria
-
 Azerbaijan
-
 Bahamas
-
 Bahrain
-
 Bangladesh
-
 Belarus
-
 Belgium
-
 Bolivia
-
 Botswana
-
 Brazil
-
 Brunei
-
 Bulgaria
-
 Cambodia
-
 Cameroon
-
 Canada
-
 Chile
Chile
-
 China
China
-
 Colombia
-
 Congo
Congo
-
 Costa Rica
-
 Cote d'Ivoire
-
 Croatia
-
 Cuba
Cuba
-
 Cyprus
-
 Czechia
-
 DR Congo
-
 Denmark
-
 Dominican Republic
-
 Ecuador
-
 Egypt
Egypt
-
 El Salvador
-
 Estonia
-
 Eswatini
-
 Ethiopia
-
 Finland
-
 France
-
 Georgia
-
 Germany
-
 Ghana
Ghana
-
 Greece
-
 Haiti
Haiti
-
 Hong Kong
-
 Hungary
-
 India
India
-
 Indonesia
-
 Iran, Islamic republic
-
 Iraq
Iraq
-
 Ireland
-
 Israel
-
 Italy
Italy
-
 Jamaica
-
 Japan
Japan
-
 Jordan
-
 Kazakhstan
-
 Kenya
Kenya
-
 Korea
Korea
-
 Kuwait
-
 Kyrgyzstan
-
 Laos
Laos
-
 Latvia
-
 Lebanon
-
 Lesotho
-
 Libya
Libya
-
 Lithuania
-
 Luxembourg
-
 Madagascar
-
 Malaysia
-
 Malta
Malta
-
 Mauritius
-
 Mexico
-
 Moldova
-
 Mongolia
-
 Montenegro
-
 Morocco
-
 Mozambique
-
 Myanmar
-
 Namibia
-
 Nepal
Nepal
-
 Netherlands
-
 New Zealand
-
 Nigeria
-
 North Macedonia
-
 Norway
-
 Oman
Oman
-
 Pakistan
-
 Palestine
-
 Panama
-
 Papua New Guinea
-
 Paraguay
-
 Peru
Peru
-
 Philippines
-
 Poland
-
 Portugal
-
 Puerto Rico
-
 Qatar
Qatar
-
 Reunion
-
 Romania
-
 Rwanda
-
 Saudi Arabia
-
 Serbia
-
 Singapore
-
 Slovakia
-
 Slovenia
-
 Somalia
-
 South Africa
-
 Spain
Spain
-
 Sri Lanka
-
 Sweden
-
 Switzerland
-
 Syria
Syria
-
 Taiwan
-
 Tajikistan
-
 Tanzania
-
 Thailand
-
 Trinidad and Tobago
-
 Tunisia
-
 Turkey
-
 UAE
UAE
-
 Uganda
-
 Ukraine
-
 United Kingdom
-
United States
-
 Uruguay
-
 Uzbekistan
-
 Venezuela
-
 Vietnam
-
 Yemen
Yemen
-
 Zambia
-
 Zimbabwe
- Forex
- Crypto











