
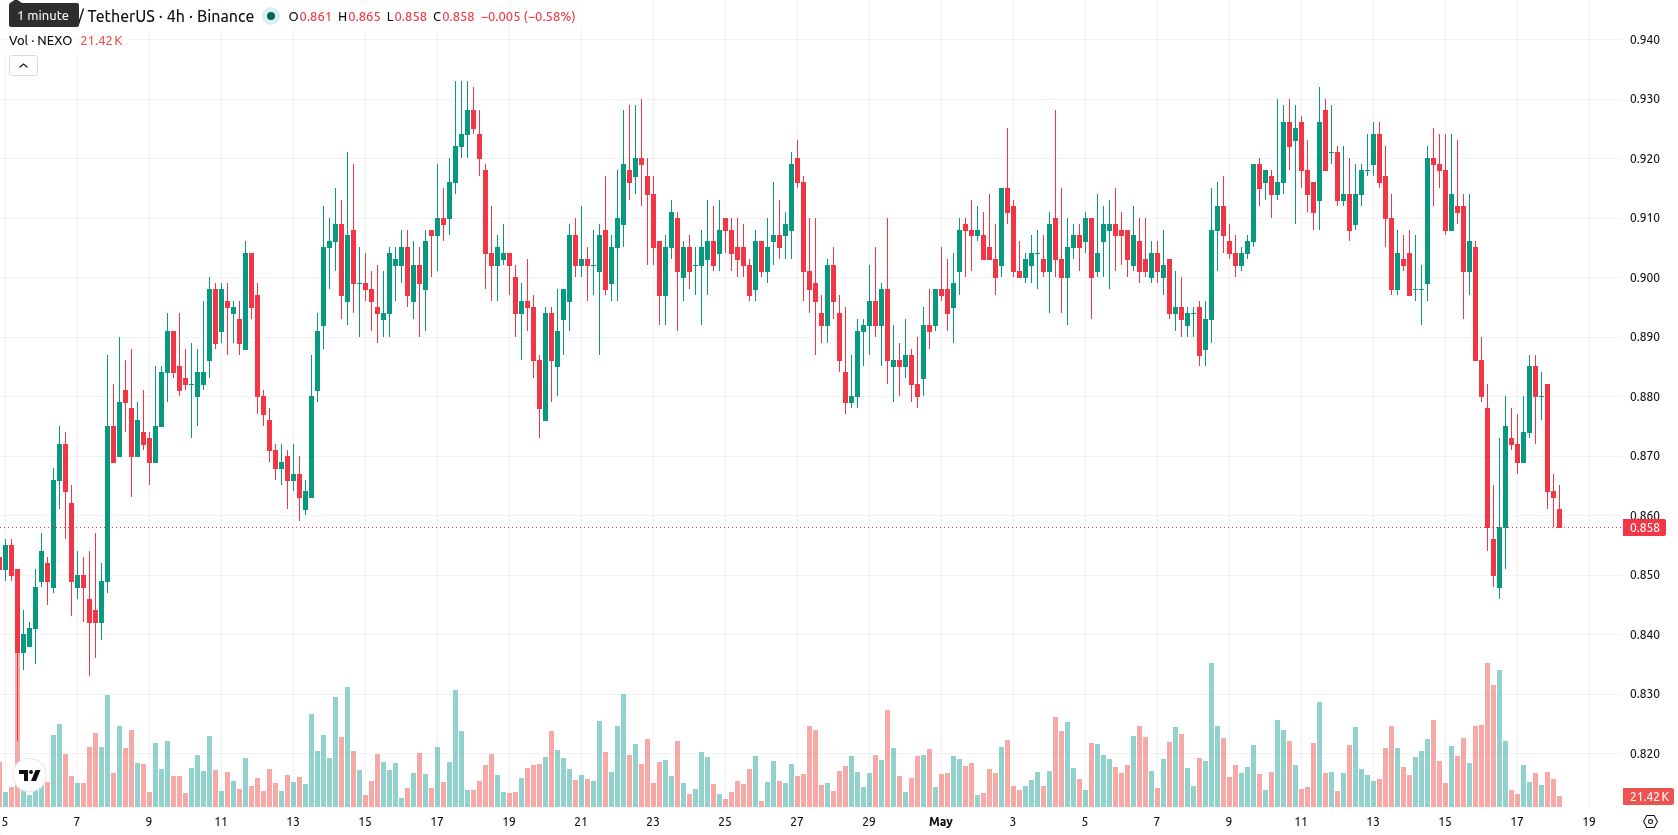
Nexo tests key $0.8560 support level amid bearish momentum signals: weekly analysis

Nexo (NEXO) is currently trading below both the weekly MA-20 ($0.8836) and MA-50 ($1.0569), indicating persistent selling pressure and a bearish tone for both the medium- and longer-term trends. Over the past week, NEXO has declined by $0.0580 (6.33%), ending the period at the very bottom of its weekly range and testing significant support levels.
Highlights
- NEXO remains in a bearish trend, trading beneath key moving averages and encountering sustained downward momentum.
- Momentum indicators and oscillators unanimously signal that sellers maintain control, with no sign of trend reversal.
- Price is likely to fluctuate between $0.8560 and $0.8760 next week, with a strong bias toward further downside risk.
Bearish momentum confirmed as technical signals reinforce downside bias
Weekly technical analysis shows that the MA-20 now serves as dynamic resistance, with the price consistently below both the MA-20 and MA-50. Support is being tested at the lower end of the recent weekly range, with $0.8560 identified as a key support level and $0.8760 as resistance. Momentum indicators, including MACD and ADX, maintain a bearish bias, forecasting persistent downside and confirming strong trend strength. The RSI and Stochastic RSI both signal continued seller dominance without clear oversold conditions, while the CCI is neutral and Bull/Bear Power shows only a slight buyer presence. Weekly volatility is elevated at 9.46%, with all oscillators broadly agreeing on weak momentum and no notable divergences present.
Limited rebound expected next week as sideways trading favored below MA-20
Looking ahead to the next 7 days, NEXO is expected to trade within the $0.8560 to $0.8760 range. Upside potential is limited, with less than a 20% probability of a move higher given that none of the four key indicators are giving buy signals. The likeliest scenario is for the price to remain in a sideways corridor just above recent lows. A breakout above $0.8760 would require renewed buying pressure to challenge the MA-20, whereas a drop below $0.8560 could trigger further declines in line with the prevailing bearish trend.
Earlier, analysts noted that NEXO was likely to stay under medium-term bearish pressure, with sideways consolidation as the dominant outlook. The current deepening of bearish signals and the test of critical support suggest traders should watch for a potential breakdown below $0.8560, which could trigger further downside momentum.


-
 Afghanistan
-
 Albania
-
 Algeria
-
 Angola
-
 Argentina
-
 Armenia
-
 Australia
-
 Austria
-
 Azerbaijan
-
 Bahamas
-
 Bahrain
-
 Bangladesh
-
 Belarus
-
 Belgium
-
 Bolivia
-
 Botswana
-
 Brazil
-
 Brunei
-
 Bulgaria
-
 Cambodia
-
 Cameroon
-
 Canada
-
 Chile
Chile
-
 China
China
-
 Colombia
-
 Congo
Congo
-
 Costa Rica
-
 Cote d'Ivoire
-
 Croatia
-
 Cuba
Cuba
-
 Cyprus
-
 Czechia
-
 DR Congo
-
 Denmark
-
 Dominican Republic
-
 Ecuador
-
 Egypt
Egypt
-
 El Salvador
-
 Estonia
-
 Eswatini
-
 Ethiopia
-
 Finland
-
 France
-
 Georgia
-
 Germany
-
 Ghana
Ghana
-
 Greece
-
 Haiti
Haiti
-
 Hong Kong
-
 Hungary
-
 India
India
-
 Indonesia
-
 Iran, Islamic republic
-
 Iraq
Iraq
-
 Ireland
-
 Israel
-
 Italy
Italy
-
 Jamaica
-
 Japan
Japan
-
 Jordan
-
 Kazakhstan
-
 Kenya
Kenya
-
 Korea
Korea
-
 Kuwait
-
 Kyrgyzstan
-
 Laos
Laos
-
 Latvia
-
 Lebanon
-
 Lesotho
-
 Libya
Libya
-
 Lithuania
-
 Luxembourg
-
 Madagascar
-
 Malaysia
-
 Malta
Malta
-
 Mauritius
-
 Mexico
-
 Moldova
-
 Mongolia
-
 Montenegro
-
 Morocco
-
 Mozambique
-
 Myanmar
-
 Namibia
-
 Nepal
Nepal
-
 Netherlands
-
 New Zealand
-
 Nigeria
-
 North Macedonia
-
 Norway
-
 Oman
Oman
-
 Pakistan
-
 Palestine
-
 Panama
-
 Papua New Guinea
-
 Paraguay
-
 Peru
Peru
-
 Philippines
-
 Poland
-
 Portugal
-
 Puerto Rico
-
 Qatar
Qatar
-
 Reunion
-
 Romania
-
 Rwanda
-
 Saudi Arabia
-
 Serbia
-
 Singapore
-
 Slovakia
-
 Slovenia
-
 Somalia
-
 South Africa
-
 Spain
Spain
-
 Sri Lanka
-
 Sweden
-
 Switzerland
-
 Syria
Syria
-
 Taiwan
-
 Tajikistan
-
 Tanzania
-
 Thailand
-
 Trinidad and Tobago
-
 Tunisia
-
 Turkey
-
 UAE
UAE
-
 Uganda
-
 Ukraine
-
 United Kingdom
-
United States
-
 Uruguay
-
 Uzbekistan
-
 Venezuela
-
 Vietnam
-
 Yemen
Yemen
-
 Zambia
-
 Zimbabwe
- Forex
- Crypto
