
ATOM edges higher amid resistance near $2.32 and neutral MACD: weekly forecast

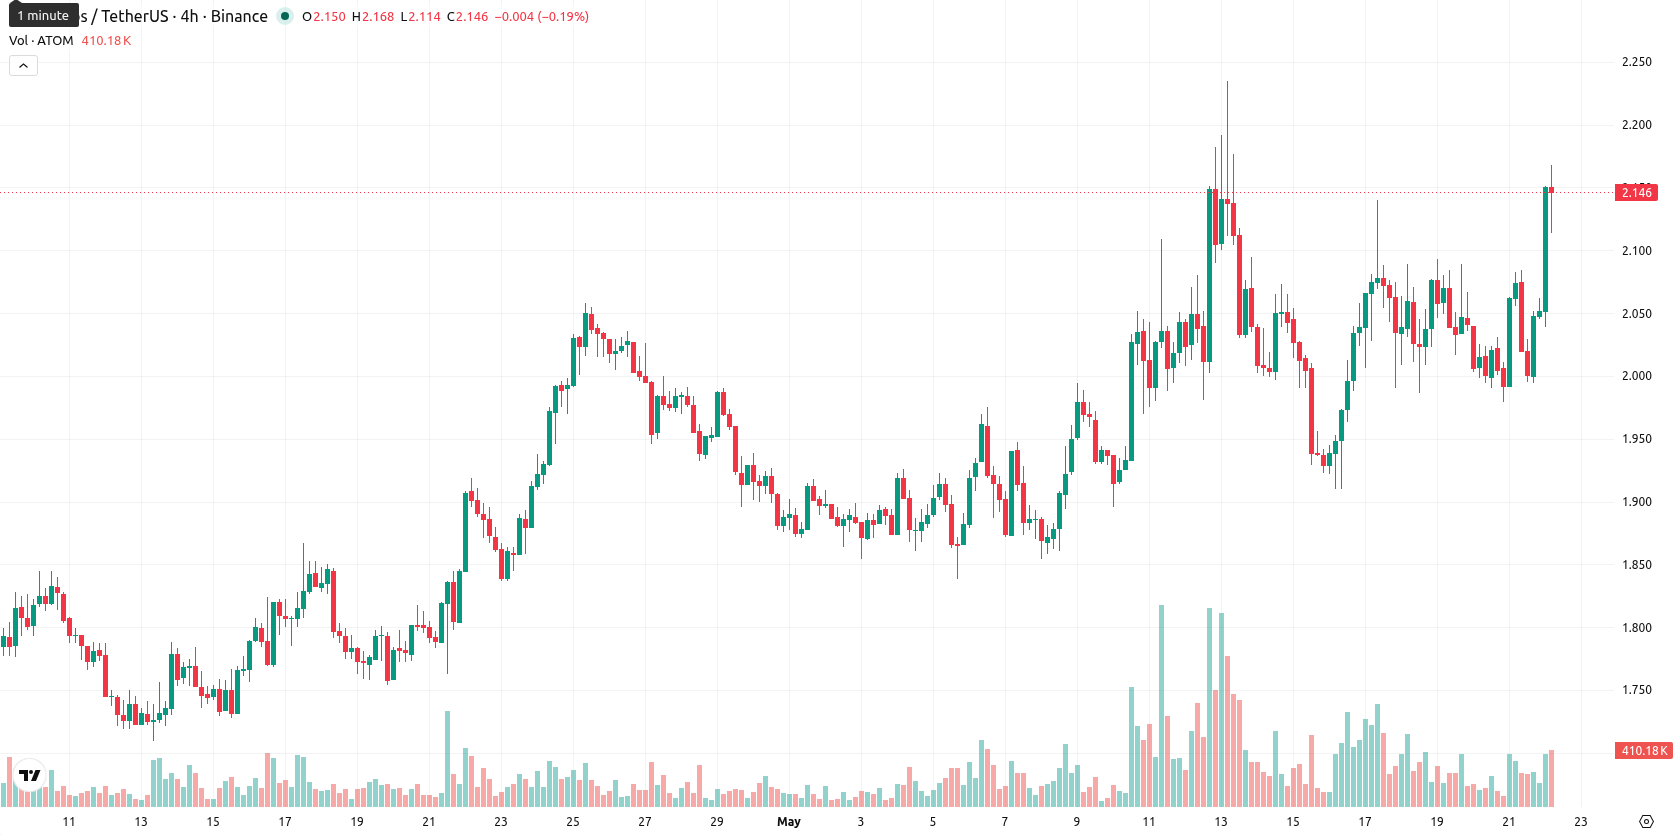
Cosmos (ATOM) is trading at $2.143, positioned above its weekly MA-20 at $1.9727 but remaining far below both the MA-50 ($2.9842) and MA-200 ($7.2287). Over the past week, ATOM gained $0.132 or 6.32%, closing the week at the upper edge of its recent range and indicating proximity to resistance.
Highlights
- ATOM advanced 6.32% last week but now trades near the top of its recent weekly range at $2.143.
- Momentum indicators present mixed signals, with overbought readings and weak trend strength suggesting buyer caution as resistance nears.
- If ATOM fails to break $2.32, sideways movement is likely; a drop below $2.07 could trigger additional downside.
Neutral to negative momentum as technical signals fail to confirm trend
On the weekly chart, ATOM holds above its MA-20 with volatility at 12.04%. Major weekly resistance stands at $2.32 and support at $2.07. While Bull/Bear Power hints at mild buyer presence, all four key momentum indicators (MACD, ADX, RSI, Stochastic RSI) remain neutral to negative, with RSI staying muted and Stochastic RSI now in overbought territory. Oscillators such as the Awesome Oscillator and CCI remain neutral, highlighting a lack of strong weekly trend confirmation.
Sideways bias with downside risk projected for the coming week
For the next 7 days, ATOM is expected to move within the $2.07 — $2.32 corridor, with a bearish bias as no principal indicators suggest a breakout. The most likely scenario is continued sideways activity just above recent support. A decisive move above $2.32 could initiate a bullish leg, but such an outcome is unlikely given fading momentum. Any close below $2.07 may accelerate declines if weekly support fails.
Earlier, analysts noted that Cosmos was experiencing long-term weakness and persistent market caution despite temporary stabilization. The latest data reinforces this cautious outlook, highlighting that momentum remains subdued and placing particular importance on the $2.07 support level as a critical threshold for downside risk in the days ahead.


-
 Afghanistan
-
 Albania
-
 Algeria
-
 Angola
-
 Argentina
-
 Armenia
-
 Australia
-
 Austria
-
 Azerbaijan
-
 Bahamas
-
 Bahrain
-
 Bangladesh
-
 Belarus
-
 Belgium
-
 Bolivia
-
 Botswana
-
 Brazil
-
 Brunei
-
 Bulgaria
-
 Cambodia
-
 Cameroon
-
 Canada
-
 Chile
Chile
-
 China
China
-
 Colombia
-
 Congo
Congo
-
 Costa Rica
-
 Cote d'Ivoire
-
 Croatia
-
 Cuba
Cuba
-
 Cyprus
-
 Czechia
-
 DR Congo
-
 Denmark
-
 Dominican Republic
-
 Ecuador
-
 Egypt
Egypt
-
 El Salvador
-
 Estonia
-
 Eswatini
-
 Ethiopia
-
 Finland
-
 France
-
 Georgia
-
 Germany
-
 Ghana
Ghana
-
 Greece
-
 Haiti
Haiti
-
 Hong Kong
-
 Hungary
-
 India
India
-
 Indonesia
-
 Iran, Islamic republic
-
 Iraq
Iraq
-
 Ireland
-
 Israel
-
 Italy
Italy
-
 Jamaica
-
 Japan
Japan
-
 Jordan
-
 Kazakhstan
-
 Kenya
Kenya
-
 Korea
Korea
-
 Kuwait
-
 Kyrgyzstan
-
 Laos
Laos
-
 Latvia
-
 Lebanon
-
 Lesotho
-
 Libya
Libya
-
 Lithuania
-
 Luxembourg
-
 Madagascar
-
 Malaysia
-
 Malta
Malta
-
 Mauritius
-
 Mexico
-
 Moldova
-
 Mongolia
-
 Montenegro
-
 Morocco
-
 Mozambique
-
 Myanmar
-
 Namibia
-
 Nepal
Nepal
-
 Netherlands
-
 New Zealand
-
 Nigeria
-
 North Macedonia
-
 Norway
-
 Oman
Oman
-
 Pakistan
-
 Palestine
-
 Panama
-
 Papua New Guinea
-
 Paraguay
-
 Peru
Peru
-
 Philippines
-
 Poland
-
 Portugal
-
 Puerto Rico
-
 Qatar
Qatar
-
 Reunion
-
 Romania
-
 Rwanda
-
 Saudi Arabia
-
 Serbia
-
 Singapore
-
 Slovakia
-
 Slovenia
-
 Somalia
-
 South Africa
-
 Spain
Spain
-
 Sri Lanka
-
 Sweden
-
 Switzerland
-
 Syria
Syria
-
 Taiwan
-
 Tajikistan
-
 Tanzania
-
 Thailand
-
 Trinidad and Tobago
-
 Tunisia
-
 Turkey
-
 UAE
UAE
-
 Uganda
-
 Ukraine
-
 United Kingdom
-
United States
-
 Uruguay
-
 Uzbekistan
-
 Venezuela
-
 Vietnam
-
 Yemen
Yemen
-
 Zambia
-
 Zimbabwe
- Forex
- Crypto
