

Render ticks up within $1.65-$2.02 corridor as RSI signals continued sell pressure: weekly review

Render (RNDR) is currently trading at $1.84, positioning itself above the weekly MA-20 at $1.7465 but below the MA-50 at $2.4546. Over the past week, the price inched up by $0.0010, or 0.05%, reflecting a week of muted movement and consolidation near recent lows in the lower range, relative to its W1 moving averages.
 1.398
1.6400
Highlights
- Render is consolidating between $1.65 and $2.02 after a negligible weekly gain of 0.05%, indicating limited upward momentum.
- Momentum indicators collectively signal bearish bias, with overbought oscillators and strong sell signals outweighing intermittent buyer interest.
- The probability of a sustained breakout above $2.02 remains low, while a move below $1.65 is favored by current market signals.
Indicator divergence defines weekly resistance and momentum profiles
Technical indicators on the weekly timeframe show mixed signals. The asset sits just under the Ichimoku Kijun at $1.9175, suggesting nearby resistance, while the MA-20 continues to provide short-term support. Resistance is reinforced by the MA-50 at $2.4546. RSI on the weekly chart reads 48.22, indicating a Sell bias, while the weekly Stochastic RSI is Overbought and the CCI is Neutral. MACD issues a Strong Sell, ADX shows a Neutral trend, and the Bull/Bear Power is Strong Buy, notably revealing a division among the key signals. Weekly volatility is 21.30%, with support around $1.65 and resistance at $2.02.
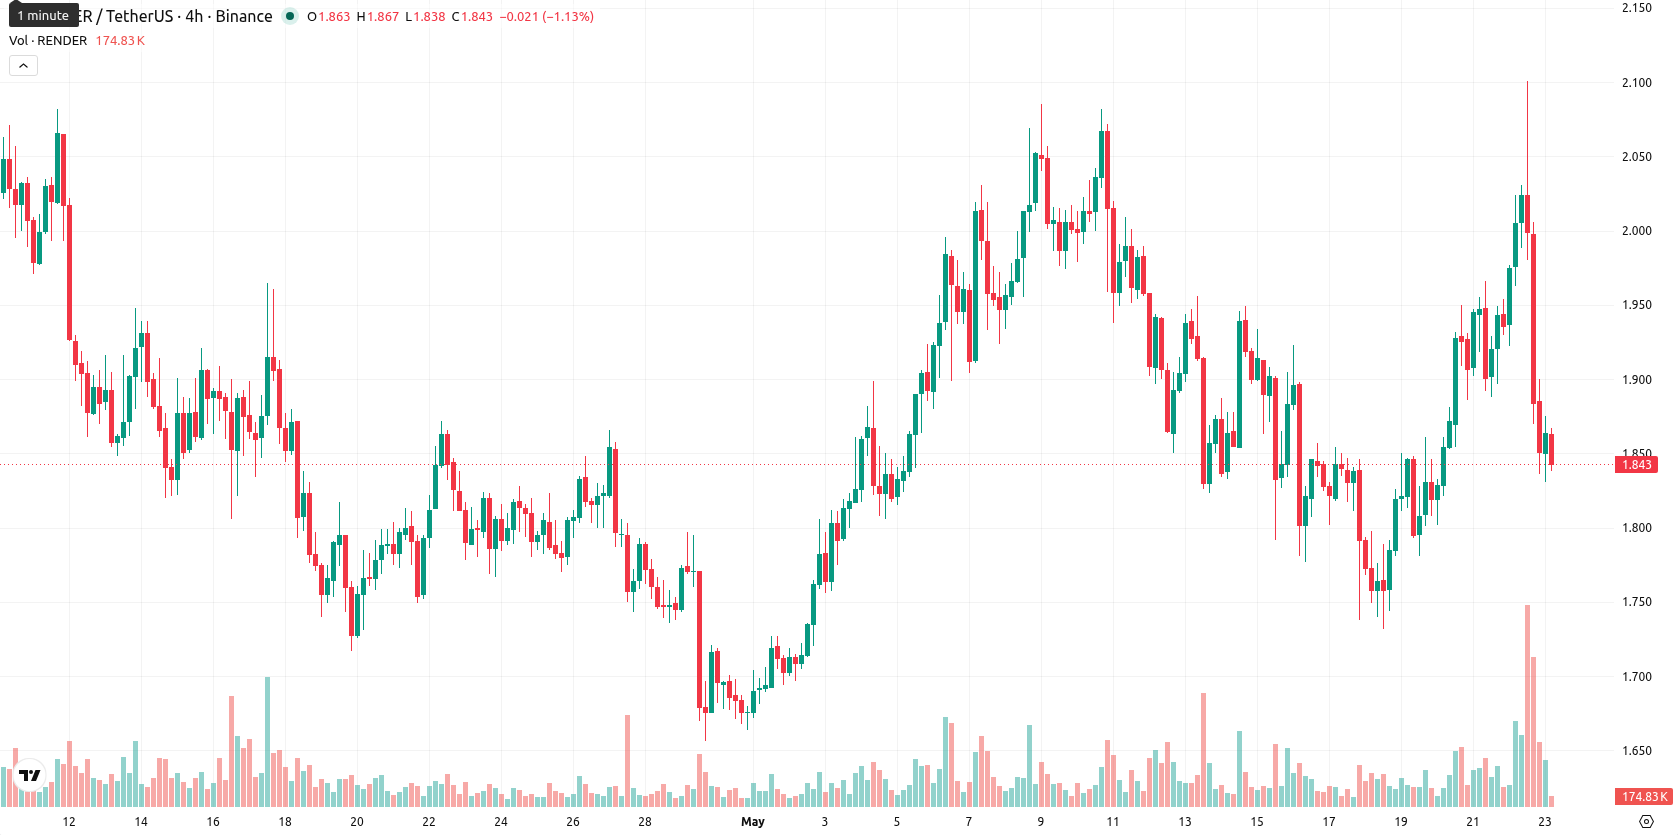
Sideways-to-bearish bias expected amid weak breakout signals this week
For the next 7 days, Render is expected to consolidate between $1.65 and $2.02, in line with recent volatility. With none of the four key momentum signals giving a Buy or Strong Buy, the likelihood of a break above $2.02 is low, and technicals favor a sideways-to-bearish scenario. The baseline expectation is continued trading within this corridor; failure to hold above $1.65 may result in further losses. Any bullish breakout will require a significant momentum shift not currently signaled by the W1 indicators.
Earlier, analysts noted that Render was showing signs of short-term weakness as technical momentum shifted towards a bearish outlook. Fresh weekly data confirms this bias, signaling that traders should closely monitor the $1.65 support level as continued consolidation or a breakdown becomes increasingly likely in the days ahead.










-
 Afghanistan
-
 Albania
-
 Algeria
-
 Angola
-
 Argentina
-
 Armenia
-
 Australia
-
 Austria
-
 Azerbaijan
-
 Bahamas
-
 Bahrain
-
 Bangladesh
-
 Belarus
-
 Belgium
-
 Bolivia
-
 Botswana
-
 Brazil
-
 Brunei
-
 Bulgaria
-
 Cambodia
-
 Cameroon
-
 Canada
-
 Chile
-
 China
-
 Colombia
-
 Congo
-
 Costa Rica
-
 Cote d'Ivoire
-
 Croatia
-
 Cuba
-
 Cyprus
-
 Czechia
-
 DR Congo
-
 Denmark
-
 Dominican Republic
-
 Ecuador
-
 Egypt
-
 El Salvador
-
 Estonia
-
 Eswatini
-
 Ethiopia
-
 Finland
-
 France
-
 Georgia
-
 Germany
-
 Ghana
-
 Greece
-
 Haiti
-
 Hong Kong
-
 Hungary
-
 India
-
 Indonesia
-
 Iran, Islamic republic
-
 Iraq
-
 Ireland
-
 Israel
-
 Italy
-
 Jamaica
-
 Japan
-
 Jordan
-
 Kazakhstan
-
 Kenya
-
 Korea
-
 Kuwait
-
 Kyrgyzstan
-
 Laos
-
 Latvia
-
 Lebanon
-
 Lesotho
-
 Libya
-
 Lithuania
-
 Luxembourg
-
 Madagascar
-
 Malaysia
-
 Malta
-
 Mauritius
-
 Mexico
-
 Moldova
-
 Mongolia
-
 Montenegro
-
 Morocco
-
 Mozambique
-
 Myanmar
-
 Namibia
-
 Nepal
-
 Netherlands
-
 New Zealand
-
 Nigeria
-
 North Macedonia
-
 Norway
-
 Oman
-
 Pakistan
-
 Palestine
-
 Panama
-
 Papua New Guinea
-
 Paraguay
-
 Peru
-
 Philippines
-
 Poland
-
 Portugal
-
 Puerto Rico
-
 Qatar
-
 Reunion
-
 Romania
-
 Rwanda
-
 Saudi Arabia
-
 Serbia
-
 Singapore
-
 Slovakia
-
 Slovenia
-
 Somalia
-
 South Africa
-
 Spain
-
 Sri Lanka
-
 Sweden
-
 Switzerland
-
 Syria
-
 Taiwan
-
 Tajikistan
-
 Tanzania
-
 Thailand
-
 Trinidad and Tobago
-
 Tunisia
-
 Turkey
-
 UAE
-
 Uganda
-
 Ukraine
-
 United Kingdom
-
United States
-
 Uruguay
-
 Uzbekistan
-
 Venezuela
-
 Vietnam
-
 Yemen
-
 Zambia
-
 Zimbabwe
- Forex
- Crypto












