
Render falls as immediate resistance caps further upside

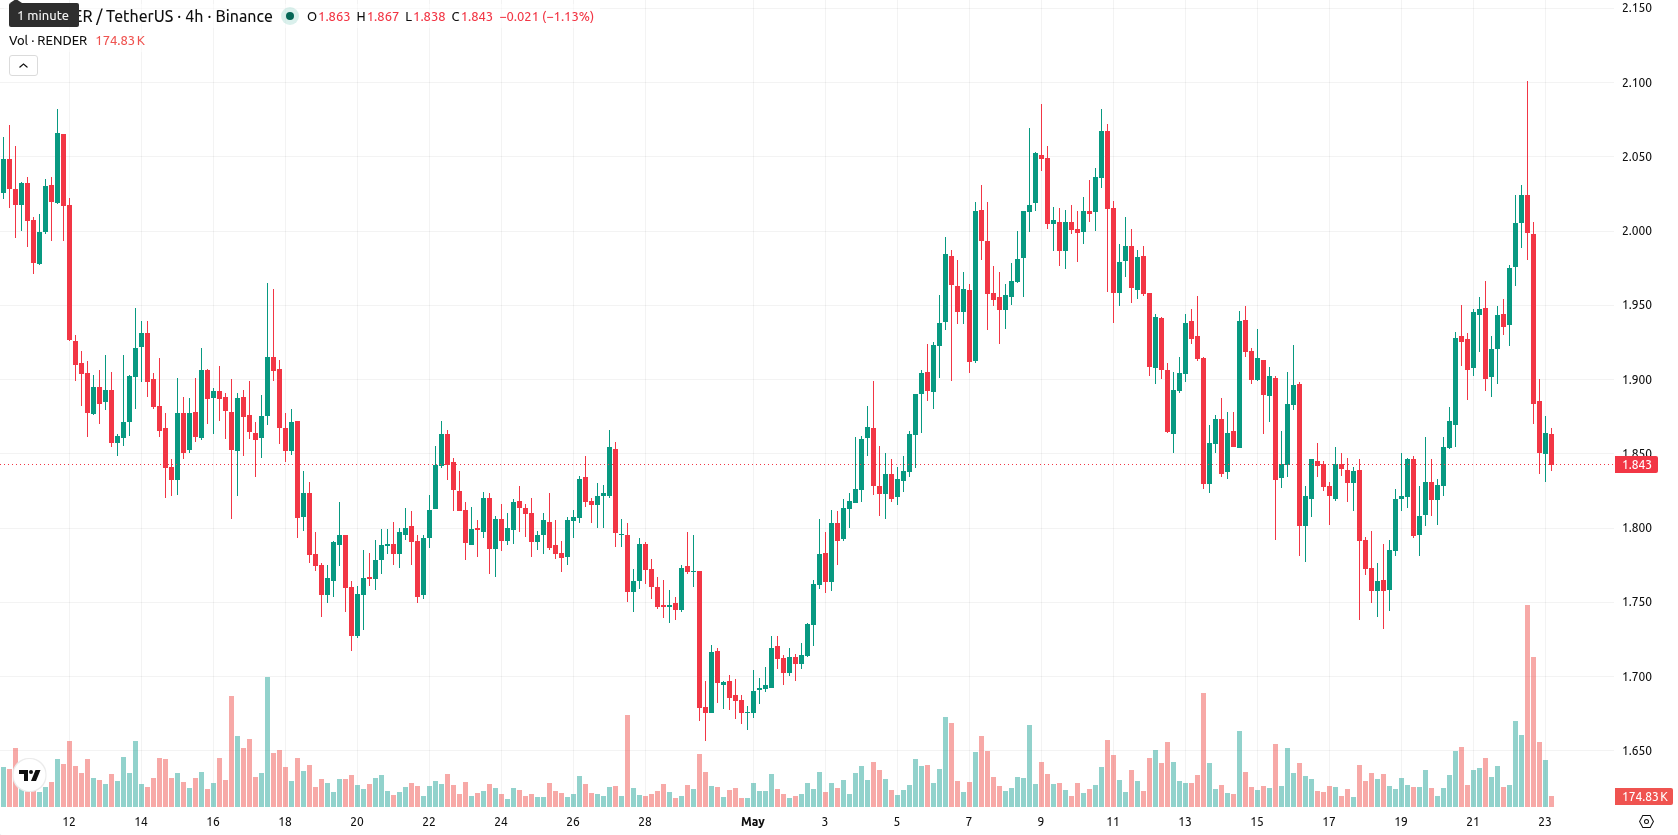
Render (RENDER) is trading at $1.839, marking a 7.91% decline on the day. The asset sits below its key short- and medium-term moving averages, but remains above long-term levels.
Highlights
- RENDER faces persistent seller pressure in the short and medium term, despite support from its longer-term trend structure.
- Momentum indicators are mixed, with most oscillators signaling bearish sentiment while some divergence hints at potential for a technical rebound.
- RENDER is expected to trade sideways between $1.76 and $1.86 over the next five days, with sub-20% odds for a short-term rally.
Mixed momentum and resistance cap price near short-term lows
RENDER is trading below the SMA-20 ($1.9000) and SMA-50 ($1.8699), while holding above the SMA-200 ($1.7470). The Ichimoku Kijun level at $1.8785 acts as an immediate resistance. On the momentum side, MACD signals a strong buy on the daily chart, but the ADX points to weak trend strength. RSI and CCI are neutral to mildly bearish, and the Stochastic RSI veers towards oversold territory. Bull/Bear Power shows modest buyer dominance, though current daily price action remains negative, with the price tracking near session lows within a narrow $1.831–$1.875 range. The Awesome Oscillator supports the possibility of a bullish reversal, but most oscillators point to prevailing selling momentum and a divergence with overall price action.
Sideways to downward bias as breakout odds remain limited
Over the next five trading days, RENDER is likely to fluctuate within a $1.760 to $1.860 volatility band relative to current levels. The probability of a price increase is low (less than 20%), favoring further declines in the short term. The baseline scenario suggests sideways movement within this range. Upside would require a sustained breakout above resistance near $1.88, while downside risk becomes pronounced below $1.76, exposing lower support levels.
Earlier, analysts noted that Render was building short-term strength, with bullish momentum and moving averages suggesting the potential for a sustained recovery. The current breakdown below several key technical levels signals a shift toward a more bearish outlook, making a sustained move above $1.88 the primary level to watch for any reversal in sentiment.


-
 Afghanistan
-
 Albania
-
 Algeria
-
 Angola
-
 Argentina
-
 Armenia
-
 Australia
-
 Austria
-
 Azerbaijan
-
 Bahamas
-
 Bahrain
-
 Bangladesh
-
 Belarus
-
 Belgium
-
 Bolivia
-
 Botswana
-
 Brazil
-
 Brunei
-
 Bulgaria
-
 Cambodia
-
 Cameroon
-
 Canada
-
 Chile
Chile
-
 China
China
-
 Colombia
-
 Congo
Congo
-
 Costa Rica
-
 Cote d'Ivoire
-
 Croatia
-
 Cuba
Cuba
-
 Cyprus
-
 Czechia
-
 DR Congo
-
 Denmark
-
 Dominican Republic
-
 Ecuador
-
 Egypt
Egypt
-
 El Salvador
-
 Estonia
-
 Eswatini
-
 Ethiopia
-
 Finland
-
 France
-
 Georgia
-
 Germany
-
 Ghana
Ghana
-
 Greece
-
 Haiti
Haiti
-
 Hong Kong
-
 Hungary
-
 India
India
-
 Indonesia
-
 Iran, Islamic republic
-
 Iraq
Iraq
-
 Ireland
-
 Israel
-
 Italy
Italy
-
 Jamaica
-
 Japan
Japan
-
 Jordan
-
 Kazakhstan
-
 Kenya
Kenya
-
 Korea
Korea
-
 Kuwait
-
 Kyrgyzstan
-
 Laos
Laos
-
 Latvia
-
 Lebanon
-
 Lesotho
-
 Libya
Libya
-
 Lithuania
-
 Luxembourg
-
 Madagascar
-
 Malaysia
-
 Malta
Malta
-
 Mauritius
-
 Mexico
-
 Moldova
-
 Mongolia
-
 Montenegro
-
 Morocco
-
 Mozambique
-
 Myanmar
-
 Namibia
-
 Nepal
Nepal
-
 Netherlands
-
 New Zealand
-
 Nigeria
-
 North Macedonia
-
 Norway
-
 Oman
Oman
-
 Pakistan
-
 Palestine
-
 Panama
-
 Papua New Guinea
-
 Paraguay
-
 Peru
Peru
-
 Philippines
-
 Poland
-
 Portugal
-
 Puerto Rico
-
 Qatar
Qatar
-
 Reunion
-
 Romania
-
 Rwanda
-
 Saudi Arabia
-
 Serbia
-
 Singapore
-
 Slovakia
-
 Slovenia
-
 Somalia
-
 South Africa
-
 Spain
Spain
-
 Sri Lanka
-
 Sweden
-
 Switzerland
-
 Syria
Syria
-
 Taiwan
-
 Tajikistan
-
 Tanzania
-
 Thailand
-
 Trinidad and Tobago
-
 Tunisia
-
 Turkey
-
 UAE
UAE
-
 Uganda
-
 Ukraine
-
 United Kingdom
-
United States
-
 Uruguay
-
 Uzbekistan
-
 Venezuela
-
 Vietnam
-
 Yemen
Yemen
-
 Zambia
-
 Zimbabwe
- Forex
- Crypto
