
Render holds steady around $1.45 amid deeply oversold RSI and CCI readings: weekly analysis

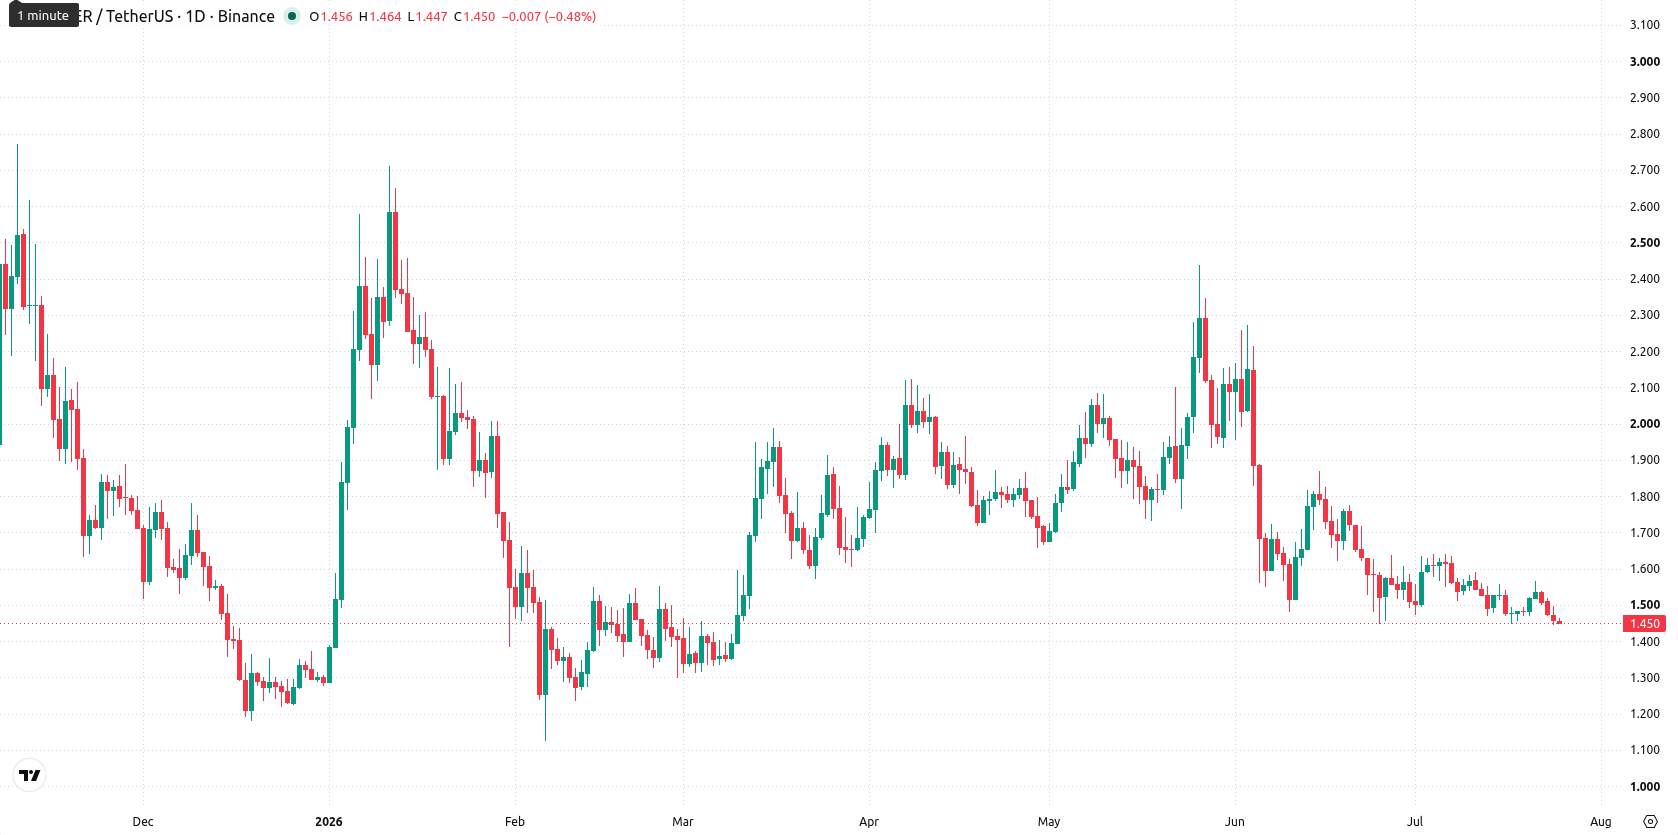
Render Network (RNDR) lost $0.0180 (1.29%) over the past week, closing at the bottom of its weekly range and remaining well below both the MA-20 ($1.7511) and MA-50 ($2.0981). The asset is now under persistent medium- and long-term selling pressure according to weekly moving averages.
 1.464
1.5650
1.464
1.5650
Highlights
- Render continues to trade below key moving averages, reflecting persistent medium- and long-term selling pressure.
- Technical momentum indicators show oversold conditions and weak trend strength, but no signal of an imminent reversal.
- Render's expected price range for next week is $1.33–$1.57, with downside risk dominating and support at $1.33 vulnerable.
Bearish momentum accelerates this week amid oversold signals
On the weekly chart, RNDR trades significantly beneath all major moving averages: MA-20 at $1.7511 and MA-50 at $2.0981. The Ichimoku Kijun sits at $1.7800 — over 30% above the current price — with MA-20 as the closest notable dynamic resistance. The technical picture remains bearish, with the MACD signaling sustained downside, ADX showing there is no prevailing trend, and deeply oversold conditions on weekly RSI, Stochastic RSI, and CCI. The Bull/Bear Power and Awesome Oscillator both confirm strong seller control, while support is weak and volatility for the week stands at 8.30%.
Sideways outlook projected as selling risks persist for next week
Looking ahead to the next 7 days, the expected trading range for RNDR is $1.33 – $1.57 based on recent volatility and technicals. There is a low probability of a bounce above MA-20 and toward $1.57, as none of the four main weekly indicators have triggered a buy signal. The baseline scenario points toward sideways consolidation just above support, but if selling pressure persists, there is a risk of breakdown toward new lows below $1.33.
Earlier, analysts noted that Render Network was experiencing sustained bearish pressure and persistent weakness across major technical indicators. The latest data reinforce this outlook, with continued downside risk making a breakdown below $1.33 the key level for traders to monitor in the week ahead.








-
 Afghanistan
-
 Albania
-
 Algeria
-
 Angola
-
 Argentina
-
 Armenia
-
 Australia
-
 Austria
-
 Azerbaijan
-
 Bahamas
-
 Bahrain
-
 Bangladesh
-
 Belarus
-
 Belgium
-
 Bolivia
-
 Botswana
-
 Brazil
-
 Brunei
-
 Bulgaria
-
 Cambodia
-
 Cameroon
-
 Canada
-
 Chile
Chile
-
 China
China
-
 Colombia
-
 Congo
Congo
-
 Costa Rica
-
 Cote d'Ivoire
-
 Croatia
-
 Cuba
Cuba
-
 Cyprus
-
 Czechia
-
 DR Congo
-
 Denmark
-
 Dominican Republic
-
 Ecuador
-
 Egypt
Egypt
-
 El Salvador
-
 Estonia
-
 Eswatini
-
 Ethiopia
-
 Finland
-
 France
-
 Georgia
-
 Germany
-
 Ghana
Ghana
-
 Greece
-
 Haiti
Haiti
-
 Hong Kong
-
 Hungary
-
 India
India
-
 Indonesia
-
 Iran, Islamic republic
-
 Iraq
Iraq
-
 Ireland
-
 Israel
-
 Italy
Italy
-
 Jamaica
-
 Japan
Japan
-
 Jordan
-
 Kazakhstan
-
 Kenya
Kenya
-
 Korea
Korea
-
 Kuwait
-
 Kyrgyzstan
-
 Laos
Laos
-
 Latvia
-
 Lebanon
-
 Lesotho
-
 Libya
Libya
-
 Lithuania
-
 Luxembourg
-
 Madagascar
-
 Malaysia
-
 Malta
Malta
-
 Mauritius
-
 Mexico
-
 Moldova
-
 Mongolia
-
 Montenegro
-
 Morocco
-
 Mozambique
-
 Myanmar
-
 Namibia
-
 Nepal
Nepal
-
 Netherlands
-
 New Zealand
-
 Nigeria
-
 North Macedonia
-
 Norway
-
 Oman
Oman
-
 Pakistan
-
 Palestine
-
 Panama
-
 Papua New Guinea
-
 Paraguay
-
 Peru
Peru
-
 Philippines
-
 Poland
-
 Portugal
-
 Puerto Rico
-
 Qatar
Qatar
-
 Reunion
-
 Romania
-
 Rwanda
-
 Saudi Arabia
-
 Serbia
-
 Singapore
-
 Slovakia
-
 Slovenia
-
 Somalia
-
 South Africa
-
 Spain
Spain
-
 Sri Lanka
-
 Sweden
-
 Switzerland
-
 Syria
Syria
-
 Taiwan
-
 Tajikistan
-
 Tanzania
-
 Thailand
-
 Trinidad and Tobago
-
 Tunisia
-
 Turkey
-
 UAE
UAE
-
 Uganda
-
 Ukraine
-
 United Kingdom
-
United States
-
 Uruguay
-
 Uzbekistan
-
 Venezuela
-
 Vietnam
-
 Yemen
Yemen
-
 Zambia
-
 Zimbabwe
- Forex
- Crypto












