
Toncoin price prediction: $2.10 resistance in focus as TON gains 7.08%

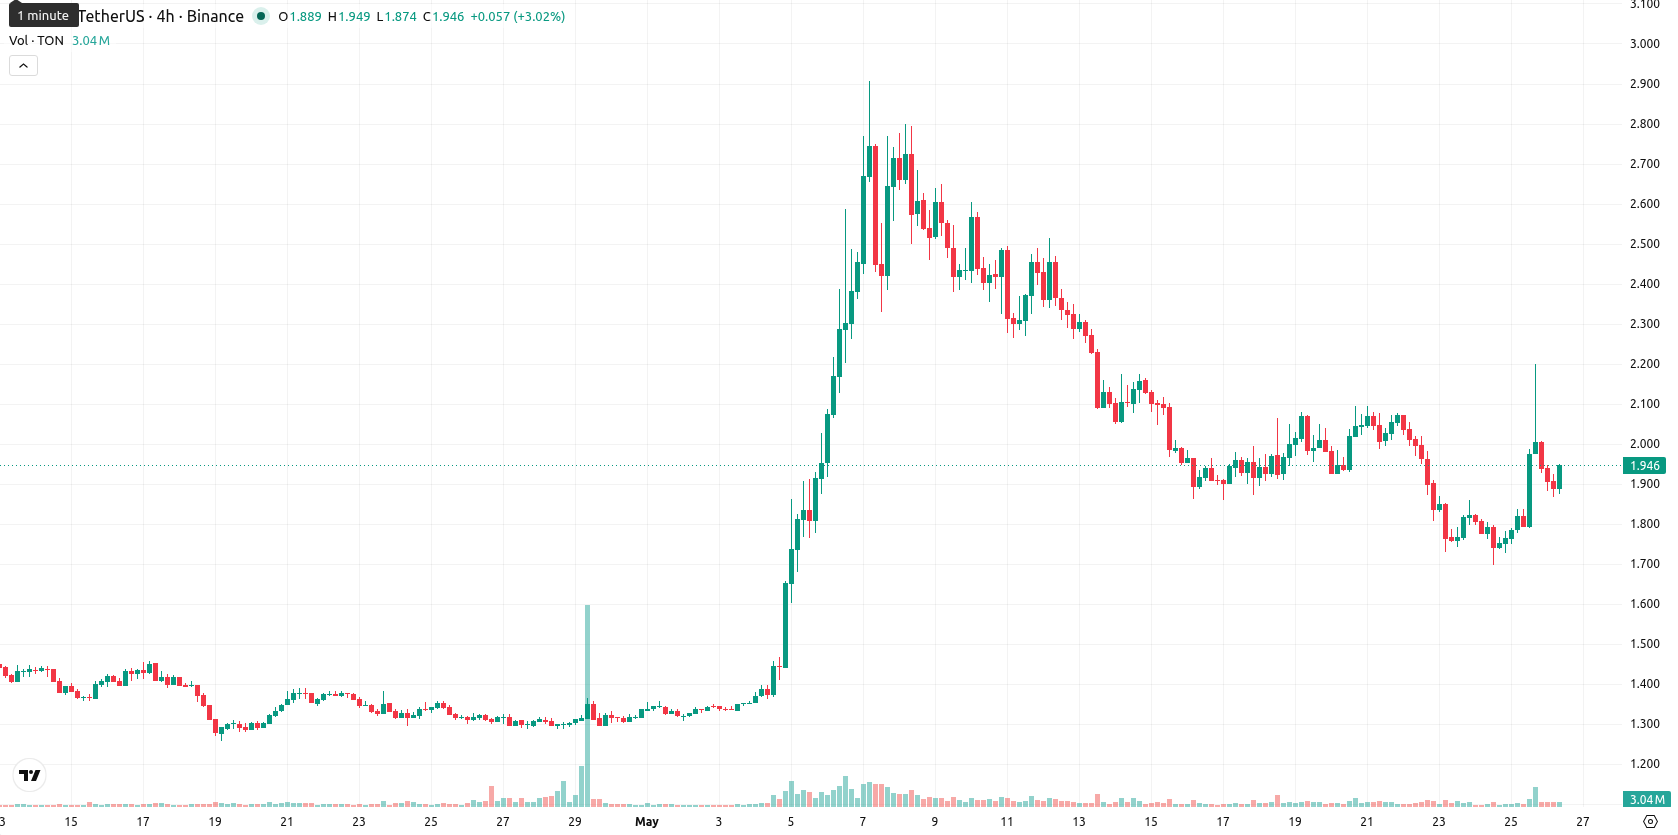
Toncoin (TON) is trading at $1.937, up 7.08% on the day. The asset currently sits below its key short-term moving averages but remains above its longer-term trend levels.
 1.586
1.6980
1.586
1.6980
Highlights
- Toncoin's trading volume surged to $398.2 million, reflecting increased liquidity and strong demand from traders and investors.
- Integration as The Open Network's native token for Telegram deepens real-world utility and supports growing user adoption.
- Technicals indicate high intraday volatility with moderate odds of continued gains, as TON is expected to trade between $1.87 and $1.95 near resistance at $2.10.
Liquidity surge and adoption prospects as exchange volumes spike
Toncoin's rapid increase in trading volumes to around $398.2 million is driving robust liquidity, reflecting heightened demand and strong participation from both traders and investors. The asset’s integration as the native token for The Open Network, which is built for seamless use within the Telegram messaging platform, enhances its real-world utility and potential user adoption. With a circulating supply of roughly 2.69 billion tokens and active Proof of Stake incentives, the network’s structure further supports market participation and transaction activity. These factors collectively create a positive backdrop for increased attention and transactional flows in the ecosystem.
Moderate bullish setup as mixed indicators offset major resistance
TON's key technical configuration shows the current price is trading below the MA-20 ($2.140), while holding above the MA-50 ($1.678) and MA-200 ($1.553). The daily Ichimoku Kijun level at $2.104 forms immediate resistance overhead. On the indicator front, daily MACD and ADX both give Buy signals, confirming positive momentum, while the RSI at 52 points to mildly bullish conditions without overbought risk. Stoch RSI is supportive of gains, and BBP at 0.248 suggests ongoing buyer dominance intraday. However, CCI is in Sell territory, indicating a risk of near-term pullback, and the Awesome Oscillator is neutral, reflecting recent volatility and session highs despite some short-term oscillator divergence.
Sideways trading outlook as volatility constrains breakout potential
For the next five trading days, TON is expected to remain within a pricing corridor of $1.87 to $1.95, consistent with its current volatility. The baseline scenario is continued sideways movement at these levels, though a breakout above the $2.10 resistance could trigger renewed upward momentum. Conversely, a move below $1.87 would signal increased bearish pressure and the start of a potential downside phase.
Earlier, analysts noted that Toncoin was navigating mixed technical signals and a consolidating market backdrop stemming from both ecosystem developments and heightened volatility. The current landscape, marked by surging trading volumes and sustained momentum, suggests traders should monitor for a potential breakout above the $2.10 resistance as a trigger for a directional move.









-
 Afghanistan
-
 Albania
-
 Algeria
-
 Angola
-
 Argentina
-
 Armenia
-
 Australia
-
 Austria
-
 Azerbaijan
-
 Bahamas
-
 Bahrain
-
 Bangladesh
-
 Belarus
-
 Belgium
-
 Bolivia
-
 Botswana
-
 Brazil
-
 Brunei
-
 Bulgaria
-
 Cambodia
-
 Cameroon
-
 Canada
-
 Chile
Chile
-
 China
China
-
 Colombia
-
 Congo
Congo
-
 Costa Rica
-
 Cote d'Ivoire
-
 Croatia
-
 Cuba
Cuba
-
 Cyprus
-
 Czechia
-
 DR Congo
-
 Denmark
-
 Dominican Republic
-
 Ecuador
-
 Egypt
Egypt
-
 El Salvador
-
 Estonia
-
 Eswatini
-
 Ethiopia
-
 Finland
-
 France
-
 Georgia
-
 Germany
-
 Ghana
Ghana
-
 Greece
-
 Haiti
Haiti
-
 Hong Kong
-
 Hungary
-
 India
India
-
 Indonesia
-
 Iran, Islamic republic
-
 Iraq
Iraq
-
 Ireland
-
 Israel
-
 Italy
Italy
-
 Jamaica
-
 Japan
Japan
-
 Jordan
-
 Kazakhstan
-
 Kenya
Kenya
-
 Korea
Korea
-
 Kuwait
-
 Kyrgyzstan
-
 Laos
Laos
-
 Latvia
-
 Lebanon
-
 Lesotho
-
 Libya
Libya
-
 Lithuania
-
 Luxembourg
-
 Madagascar
-
 Malaysia
-
 Malta
Malta
-
 Mauritius
-
 Mexico
-
 Moldova
-
 Mongolia
-
 Montenegro
-
 Morocco
-
 Mozambique
-
 Myanmar
-
 Namibia
-
 Nepal
Nepal
-
 Netherlands
-
 New Zealand
-
 Nigeria
-
 North Macedonia
-
 Norway
-
 Oman
Oman
-
 Pakistan
-
 Palestine
-
 Panama
-
 Papua New Guinea
-
 Paraguay
-
 Peru
Peru
-
 Philippines
-
 Poland
-
 Portugal
-
 Puerto Rico
-
 Qatar
Qatar
-
 Reunion
-
 Romania
-
 Rwanda
-
 Saudi Arabia
-
 Serbia
-
 Singapore
-
 Slovakia
-
 Slovenia
-
 Somalia
-
 South Africa
-
 Spain
Spain
-
 Sri Lanka
-
 Sweden
-
 Switzerland
-
 Syria
Syria
-
 Taiwan
-
 Tajikistan
-
 Tanzania
-
 Thailand
-
 Trinidad and Tobago
-
 Tunisia
-
 Turkey
-
 UAE
UAE
-
 Uganda
-
 Ukraine
-
 United Kingdom
-
United States
-
 Uruguay
-
 Uzbekistan
-
 Venezuela
-
 Vietnam
-
 Yemen
Yemen
-
 Zambia
-
 Zimbabwe
- Forex
- Crypto











