
Pendle falls sharply amid persistent selling pressure and weak bids

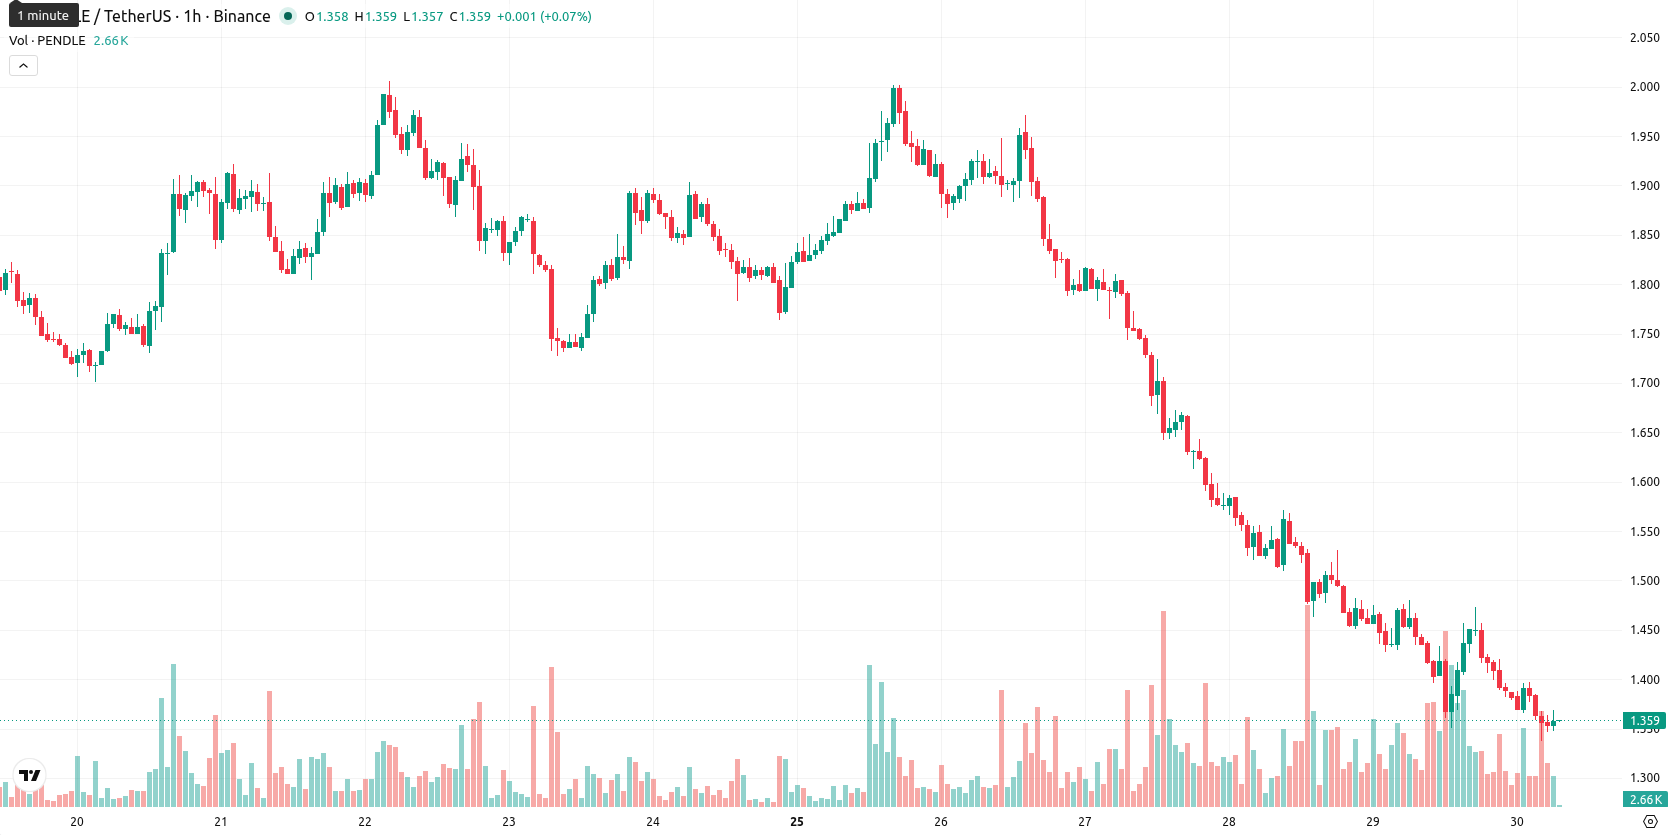
Pendle (PENDLE) is trading at $1.358, down 7.11% on the day and sitting well below its key moving averages. The asset remains under pressure after breaking sharply lower and is not showing signs of stabilization near short-, medium-, or long-term average price benchmarks.
Highlights
- PENDLE trades well below key moving averages, confirming sustained downward momentum across all timeframes.
- Technical indicators signal a strong bearish trend, with oversold readings suggesting extended selling and high volatility.
- Over the next five days, price is expected to range between $1.33 and $1.47, with over 80% probability of continued downside unless $1.33 support fails.
Momentum weakens and oversold signals persist amid rising volatility
On the technical front, the price is trading decisively below the D1 SMA-20 ($1.8383), SMA-50 ($1.5943), and SMA-200 ($1.7044), indicating sustained negative momentum across all major timeframes. The Ichimoku Kijun resistance stands at $1.7760, further capping any immediate attempts at recovery. Momentum signals remain weak: the MACD is neutral to bearish, the ADX confirms a strong trending environment with a Sell bias, and both RSI and CCI are in oversold territory. Stoch RSI also points to continued oversold momentum, while BBP is negative and sellers remain dominant in intraday trade. The Awesome Oscillator confirms a broad alignment with bearish conditions. Volatility is elevated, and the asset is trading close to the session’s low between $1.337 and $1.397.
Deeper losses seen likely as downside risk dominates forecasts
Looking ahead over the next five trading days, Pendle is expected to fluctuate in a corridor between $1.33 and $1.47, a range reflecting typical volatility relative to current levels. The statistical probability of further downside exceeds 80%, making continued pressure the baseline scenario. A breakout above immediate resistance at $1.78 would be required to alter near-term sentiment, while a breach below $1.33 could open the way for deeper losses.
Earlier, analysts noted that Pendle was under sustained bearish pressure, with technical signals pointing to continued seller dominance and oversold conditions. Current analysis not only reaffirms this negative outlook but highlights that a downside break below $1.33 now poses a heightened risk for accelerated losses in the coming sessions.


-
 Afghanistan
-
 Albania
-
 Algeria
-
 Angola
-
 Argentina
-
 Armenia
-
 Australia
-
 Austria
-
 Azerbaijan
-
 Bahamas
-
 Bahrain
-
 Bangladesh
-
 Belarus
-
 Belgium
-
 Bolivia
-
 Botswana
-
 Brazil
-
 Brunei
-
 Bulgaria
-
 Cambodia
-
 Cameroon
-
 Canada
-
 Chile
Chile
-
 China
China
-
 Colombia
-
 Congo
Congo
-
 Costa Rica
-
 Cote d'Ivoire
-
 Croatia
-
 Cuba
Cuba
-
 Cyprus
-
 Czechia
-
 DR Congo
-
 Denmark
-
 Dominican Republic
-
 Ecuador
-
 Egypt
Egypt
-
 El Salvador
-
 Estonia
-
 Eswatini
-
 Ethiopia
-
 Finland
-
 France
-
 Georgia
-
 Germany
-
 Ghana
Ghana
-
 Greece
-
 Haiti
Haiti
-
 Hong Kong
-
 Hungary
-
 India
India
-
 Indonesia
-
 Iran, Islamic republic
-
 Iraq
Iraq
-
 Ireland
-
 Israel
-
 Italy
Italy
-
 Jamaica
-
 Japan
Japan
-
 Jordan
-
 Kazakhstan
-
 Kenya
Kenya
-
 Korea
Korea
-
 Kuwait
-
 Kyrgyzstan
-
 Laos
Laos
-
 Latvia
-
 Lebanon
-
 Lesotho
-
 Libya
Libya
-
 Lithuania
-
 Luxembourg
-
 Madagascar
-
 Malaysia
-
 Malta
Malta
-
 Mauritius
-
 Mexico
-
 Moldova
-
 Mongolia
-
 Montenegro
-
 Morocco
-
 Mozambique
-
 Myanmar
-
 Namibia
-
 Nepal
Nepal
-
 Netherlands
-
 New Zealand
-
 Nigeria
-
 North Macedonia
-
 Norway
-
 Oman
Oman
-
 Pakistan
-
 Palestine
-
 Panama
-
 Papua New Guinea
-
 Paraguay
-
 Peru
Peru
-
 Philippines
-
 Poland
-
 Portugal
-
 Puerto Rico
-
 Qatar
Qatar
-
 Reunion
-
 Romania
-
 Rwanda
-
 Saudi Arabia
-
 Serbia
-
 Singapore
-
 Slovakia
-
 Slovenia
-
 Somalia
-
 South Africa
-
 Spain
Spain
-
 Sri Lanka
-
 Sweden
-
 Switzerland
-
 Syria
Syria
-
 Taiwan
-
 Tajikistan
-
 Tanzania
-
 Thailand
-
 Trinidad and Tobago
-
 Tunisia
-
 Turkey
-
 UAE
UAE
-
 Uganda
-
 Ukraine
-
 United Kingdom
-
United States
-
 Uruguay
-
 Uzbekistan
-
 Venezuela
-
 Vietnam
-
 Yemen
Yemen
-
 Zambia
-
 Zimbabwe
- Forex
- Crypto
