
Sei price prediction: Will $0.063 support hold as SEI slides 7.41%?

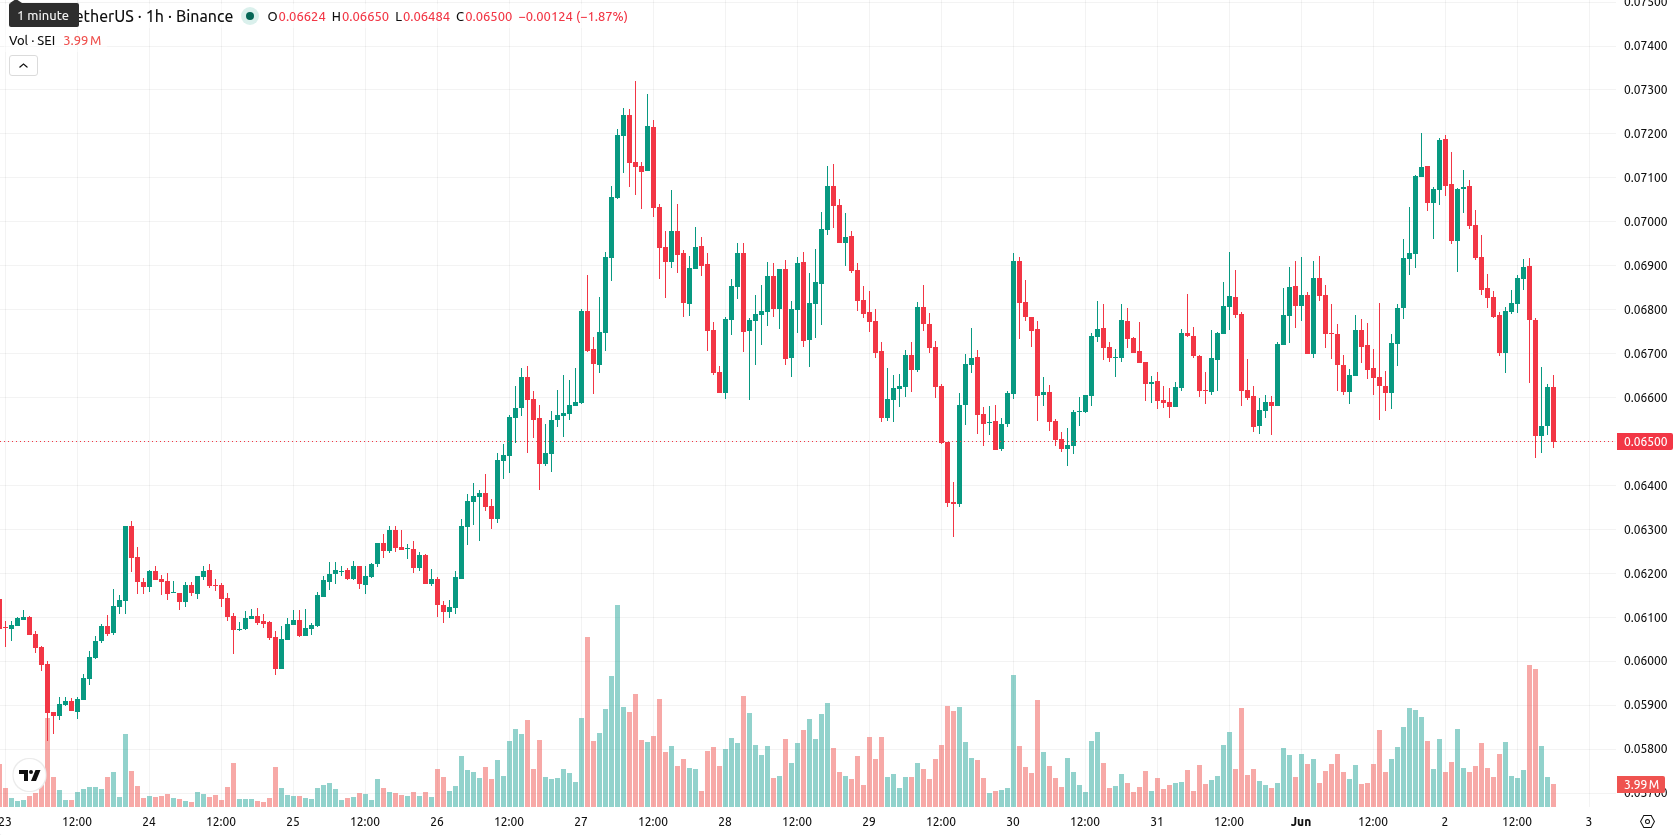
Sei (SEI) is trading at $0.065, down 7.41% on the day. The price is sitting slightly above its near-term moving averages and below the long-term trend benchmarks.
Highlights
- SEI faces increasing short-term uncertainty as strong bullish momentum conflicts with pronounced intraday selling pressure and heightened volatility.
- Despite recent upside signals, all key weekly technicals point to a greater likelihood of continued downside or sideways movement.
- Over the next week, SEI is expected to trade in the $0.063–$0.071 range, with bears in control unless $0.0692 resistance is breached.
Momentum-oscillator split signals as session closes on selling
The SMA-20 is at $0.0642, SMA-50 at $0.0621, and SMA-200 positioned much higher at $0.0877, highlighting a divergence between short/medium-term and long-term price trends. The Ichimoku Kijun level sits at $0.0692 and acts as immediate resistance. Daily chart momentum is signaled upwards by both the MACD and ADX, but oscillators like RSI (63.4), Stoch RSI (100), and CCI (121.9) show clear overbought conditions. The BBP indicator points to buyer control intraday. Today’s volatile session ranged from $0.0648 to $0.072, closing near session lows as heavy selling followed a gap-up open. This split between momentum and oscillator signals underscores short-term directional uncertainty.
Sideways bias likely as channel holds near resistance
For the next five sessions, the forecast places SEI in a typical volatility band between $0.063 and $0.071. A sustained move above the $0.0692 resistance is needed for any bullish scenario, while price action below $0.063 would increase the probability of a bearish continuation. The baseline scenario favors sideways trading unless volatility breaks this channel on either side.
Earlier, analysts noted that Sei was contending with a tug-of-war between short-term bullish momentum and broader-range indecision. With today's price retreat and signals of overbought exhaustion, traders should closely monitor whether the $0.0692 resistance caps further upside, as a failure to reclaim this level could reinforce the likelihood of continued range-bound or bearish action ahead.


-
 Afghanistan
-
 Albania
-
 Algeria
-
 Angola
-
 Argentina
-
 Armenia
-
 Australia
-
 Austria
-
 Azerbaijan
-
 Bahamas
-
 Bahrain
-
 Bangladesh
-
 Belarus
-
 Belgium
-
 Bolivia
-
 Botswana
-
 Brazil
-
 Brunei
-
 Bulgaria
-
 Cambodia
-
 Cameroon
-
 Canada
-
 Chile
Chile
-
 China
China
-
 Colombia
-
 Congo
Congo
-
 Costa Rica
-
 Cote d'Ivoire
-
 Croatia
-
 Cuba
Cuba
-
 Cyprus
-
 Czechia
-
 DR Congo
-
 Denmark
-
 Dominican Republic
-
 Ecuador
-
 Egypt
Egypt
-
 El Salvador
-
 Estonia
-
 Eswatini
-
 Ethiopia
-
 Finland
-
 France
-
 Georgia
-
 Germany
-
 Ghana
Ghana
-
 Greece
-
 Haiti
Haiti
-
 Hong Kong
-
 Hungary
-
 India
India
-
 Indonesia
-
 Iran, Islamic republic
-
 Iraq
Iraq
-
 Ireland
-
 Israel
-
 Italy
Italy
-
 Jamaica
-
 Japan
Japan
-
 Jordan
-
 Kazakhstan
-
 Kenya
Kenya
-
 Korea
Korea
-
 Kuwait
-
 Kyrgyzstan
-
 Laos
Laos
-
 Latvia
-
 Lebanon
-
 Lesotho
-
 Libya
Libya
-
 Lithuania
-
 Luxembourg
-
 Madagascar
-
 Malaysia
-
 Malta
Malta
-
 Mauritius
-
 Mexico
-
 Moldova
-
 Mongolia
-
 Montenegro
-
 Morocco
-
 Mozambique
-
 Myanmar
-
 Namibia
-
 Nepal
Nepal
-
 Netherlands
-
 New Zealand
-
 Nigeria
-
 North Macedonia
-
 Norway
-
 Oman
Oman
-
 Pakistan
-
 Palestine
-
 Panama
-
 Papua New Guinea
-
 Paraguay
-
 Peru
Peru
-
 Philippines
-
 Poland
-
 Portugal
-
 Puerto Rico
-
 Qatar
Qatar
-
 Reunion
-
 Romania
-
 Rwanda
-
 Saudi Arabia
-
 Serbia
-
 Singapore
-
 Slovakia
-
 Slovenia
-
 Somalia
-
 South Africa
-
 Spain
Spain
-
 Sri Lanka
-
 Sweden
-
 Switzerland
-
 Syria
Syria
-
 Taiwan
-
 Tajikistan
-
 Tanzania
-
 Thailand
-
 Trinidad and Tobago
-
 Tunisia
-
 Turkey
-
 UAE
UAE
-
 Uganda
-
 Ukraine
-
 United Kingdom
-
United States
-
 Uruguay
-
 Uzbekistan
-
 Venezuela
-
 Vietnam
-
 Yemen
Yemen
-
 Zambia
-
 Zimbabwe
- Forex
- Crypto
