
Cosmos drops as trading remains well below long-term average

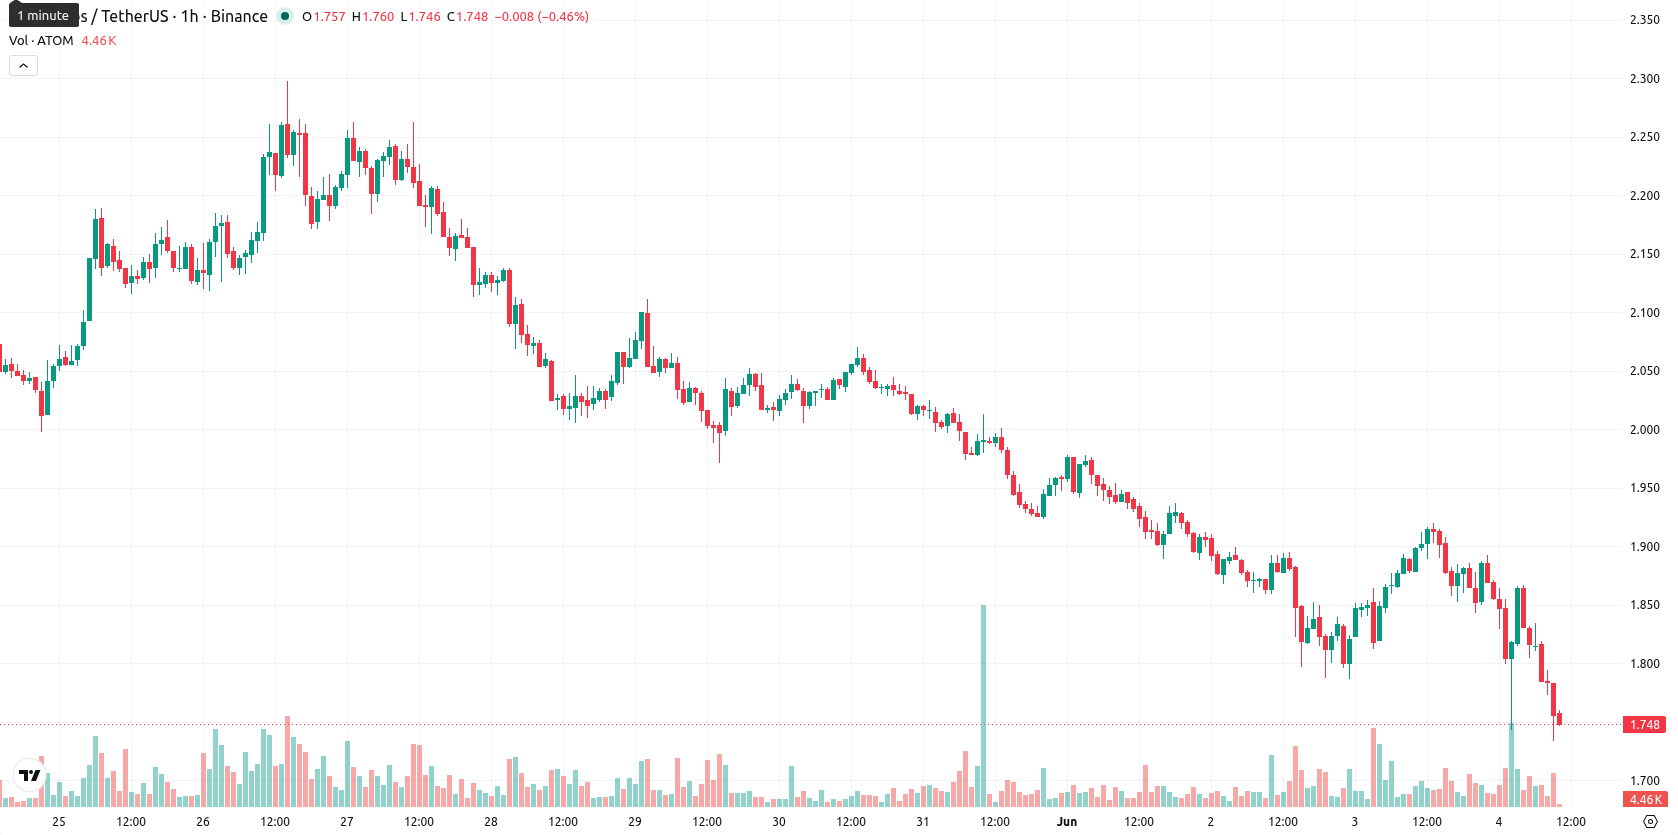
Cosmos (ATOM) is trading at $1.749, down 7.21% on the day with a sharp move lower. The asset is positioned below its key short- and long-term moving averages at this level.
 1.505
1.5940000
1.505
1.5940000
Highlights
- ATOM/USD remains firmly below all major moving averages, confirming sustained bearish pressure across short and long timeframes.
- Momentum and oscillator indicators reflect dominant selling, with oversold readings and minimal evidence of imminent reversal.
- Price is forecast to oscillate between $1.6763278 and $1.8216722 over the next few days, with downside probabilities significantly outweighing the chance of a bullish rebound.
Momentum favors sellers as price tests oversold technicals
On the technical front, ATOM/USD currently trades below the MA-20 ($1.8501000) and MA-50 ($1.8539400) on the H1 timeframe and remains beneath the MA-200 ($2.0633050) on the daily chart. The Ichimoku Kijun level at $1.8315000 represents immediate resistance. Downside momentum is confirmed by MACD and ADX sell signals, an RSI of 35.08, and both Stoch RSI and CCI in oversold territory; BBP also maintains a sell signal, reflecting ongoing seller dominance, while the Awesome Oscillator registers as neutral.
Downside favored as key support faces heightened risk
Over the next two to three days, the anticipated price range for Cosmos is $1.6763278 to $1.8216722. With a very low probability of an upward move and a very high risk of further downside, a bullish scenario would require a move above immediate resistance at the Kijun. If the price decisively breaches support near the lower boundary of the range, the bearish case may be realized; otherwise, a sideways pattern driven by typical volatility is likely to prevail.
Earlier, analysts noted that Cosmos was contending with persistent bearish momentum and sustained downside risk. The latest technical signals reinforce this view, as the asset’s position below all key moving averages and a cluster of strong sell indicators suggest traders should closely monitor for a decisive break below the current support band as the next catalyst.








-
 Afghanistan
-
 Albania
-
 Algeria
-
 Angola
-
 Argentina
-
 Armenia
-
 Australia
-
 Austria
-
 Azerbaijan
-
 Bahamas
-
 Bahrain
-
 Bangladesh
-
 Belarus
-
 Belgium
-
 Bolivia
-
 Botswana
-
 Brazil
-
 Brunei
-
 Bulgaria
-
 Cambodia
-
 Cameroon
-
 Canada
-
 Chile
Chile
-
 China
China
-
 Colombia
-
 Congo
Congo
-
 Costa Rica
-
 Cote d'Ivoire
-
 Croatia
-
 Cuba
Cuba
-
 Cyprus
-
 Czechia
-
 DR Congo
-
 Denmark
-
 Dominican Republic
-
 Ecuador
-
 Egypt
Egypt
-
 El Salvador
-
 Estonia
-
 Eswatini
-
 Ethiopia
-
 Finland
-
 France
-
 Georgia
-
 Germany
-
 Ghana
Ghana
-
 Greece
-
 Haiti
Haiti
-
 Hong Kong
-
 Hungary
-
 India
India
-
 Indonesia
-
 Iran, Islamic republic
-
 Iraq
Iraq
-
 Ireland
-
 Israel
-
 Italy
Italy
-
 Jamaica
-
 Japan
Japan
-
 Jordan
-
 Kazakhstan
-
 Kenya
Kenya
-
 Korea
Korea
-
 Kuwait
-
 Kyrgyzstan
-
 Laos
Laos
-
 Latvia
-
 Lebanon
-
 Lesotho
-
 Libya
Libya
-
 Lithuania
-
 Luxembourg
-
 Madagascar
-
 Malaysia
-
 Malta
Malta
-
 Mauritius
-
 Mexico
-
 Moldova
-
 Mongolia
-
 Montenegro
-
 Morocco
-
 Mozambique
-
 Myanmar
-
 Namibia
-
 Nepal
Nepal
-
 Netherlands
-
 New Zealand
-
 Nigeria
-
 North Macedonia
-
 Norway
-
 Oman
Oman
-
 Pakistan
-
 Palestine
-
 Panama
-
 Papua New Guinea
-
 Paraguay
-
 Peru
Peru
-
 Philippines
-
 Poland
-
 Portugal
-
 Puerto Rico
-
 Qatar
Qatar
-
 Reunion
-
 Romania
-
 Rwanda
-
 Saudi Arabia
-
 Serbia
-
 Singapore
-
 Slovakia
-
 Slovenia
-
 Somalia
-
 South Africa
-
 Spain
Spain
-
 Sri Lanka
-
 Sweden
-
 Switzerland
-
 Syria
Syria
-
 Taiwan
-
 Tajikistan
-
 Tanzania
-
 Thailand
-
 Trinidad and Tobago
-
 Tunisia
-
 Turkey
-
 UAE
UAE
-
 Uganda
-
 Ukraine
-
 United Kingdom
-
United States
-
 Uruguay
-
 Uzbekistan
-
 Venezuela
-
 Vietnam
-
 Yemen
Yemen
-
 Zambia
-
 Zimbabwe
- Forex
- Crypto











