
Cosmos slips facing medium- and long-term bearish pressure below major moving averages: weekly report

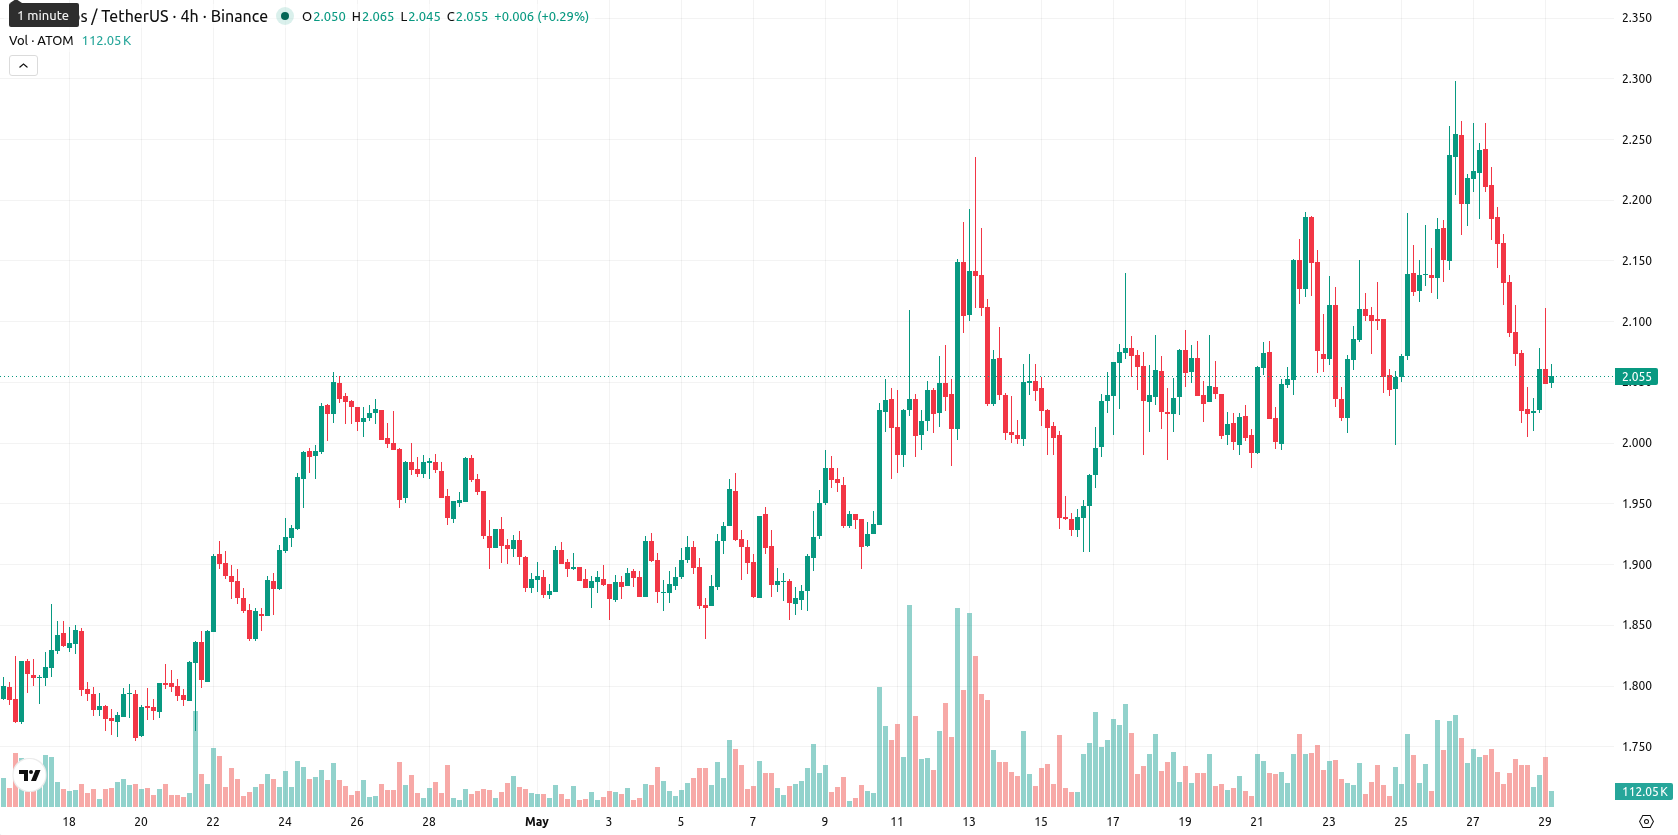
Cosmos (ATOM) is trading at $2.057 after a weekly decline of $0.083, or 3.74%. ATOM sits just above its weekly MA-20 at $1.94645, while remaining below both the MA-50 at $2.94332 and the MA-200 at $7,18714, reflecting sustained medium- and long-term bearish pressure; the MA-20 serves as immediate dynamic support.
Highlights
- ATOM trades below major resistance levels, reflecting medium- and long-term bearish pressure with weak momentum signals.
- Oscillator readings remain mixed, showing persistent seller dominance but some positive divergence and overbought exhaustion in bounce attempts.
- Expected weekly range is $2.03 to $2.16, with sideways consolidation likely and downside risk if below $2.03.
Bearish momentum persists as key resistance levels hold this week
On the weekly chart, ATOM is positioned above the MA-20 but remains clearly beneath both the MA-50 and MA-200, indicating medium-term resistance and a reinforced long-term downtrend. Key weekly support lies near $2.03, with resistance at $2.16. Momentum readings show the MACD and ADX signaling persistent selling, while the RSI and Stochastic RSI both tilt bearish — the former reflecting sell pressure and the latter suggesting overbought exhaustion. The CCI hints at a minor bullish divergence, though overall momentum remains weak, as illustrated by a high 15.02% weekly volatility.
Sideways bias favored as downside risk outweighs breakout potential next week
Looking ahead over the next 7 days, ATOM is expected to trade in a $2.03 to $2.16 range, suggesting a consolidation phase with sideways movement as the base scenario. There is about a 25% probability that ATOM could attempt a move higher, though weekly indicators point to a greater risk of continued downside. A close above $2.16 may trigger a short-term recovery, while a breakdown below $2.03 would likely lead to further bearish extension toward recent lows.
Earlier, analysts noted that Cosmos was exhibiting mixed technical signals, with heightened downside risk and a cautious outlook prevailing. The latest weekly review reinforces this stance, as persistent bearish momentum and elevated volatility suggest traders should focus on $2.03 as a critical support level in the days ahead.


-
 Afghanistan
-
 Albania
-
 Algeria
-
 Angola
-
 Argentina
-
 Armenia
-
 Australia
-
 Austria
-
 Azerbaijan
-
 Bahamas
-
 Bahrain
-
 Bangladesh
-
 Belarus
-
 Belgium
-
 Bolivia
-
 Botswana
-
 Brazil
-
 Brunei
-
 Bulgaria
-
 Cambodia
-
 Cameroon
-
 Canada
-
 Chile
Chile
-
 China
China
-
 Colombia
-
 Congo
Congo
-
 Costa Rica
-
 Cote d'Ivoire
-
 Croatia
-
 Cuba
Cuba
-
 Cyprus
-
 Czechia
-
 DR Congo
-
 Denmark
-
 Dominican Republic
-
 Ecuador
-
 Egypt
Egypt
-
 El Salvador
-
 Estonia
-
 Eswatini
-
 Ethiopia
-
 Finland
-
 France
-
 Georgia
-
 Germany
-
 Ghana
Ghana
-
 Greece
-
 Haiti
Haiti
-
 Hong Kong
-
 Hungary
-
 India
India
-
 Indonesia
-
 Iran, Islamic republic
-
 Iraq
Iraq
-
 Ireland
-
 Israel
-
 Italy
Italy
-
 Jamaica
-
 Japan
Japan
-
 Jordan
-
 Kazakhstan
-
 Kenya
Kenya
-
 Korea
Korea
-
 Kuwait
-
 Kyrgyzstan
-
 Laos
Laos
-
 Latvia
-
 Lebanon
-
 Lesotho
-
 Libya
Libya
-
 Lithuania
-
 Luxembourg
-
 Madagascar
-
 Malaysia
-
 Malta
Malta
-
 Mauritius
-
 Mexico
-
 Moldova
-
 Mongolia
-
 Montenegro
-
 Morocco
-
 Mozambique
-
 Myanmar
-
 Namibia
-
 Nepal
Nepal
-
 Netherlands
-
 New Zealand
-
 Nigeria
-
 North Macedonia
-
 Norway
-
 Oman
Oman
-
 Pakistan
-
 Palestine
-
 Panama
-
 Papua New Guinea
-
 Paraguay
-
 Peru
Peru
-
 Philippines
-
 Poland
-
 Portugal
-
 Puerto Rico
-
 Qatar
Qatar
-
 Reunion
-
 Romania
-
 Rwanda
-
 Saudi Arabia
-
 Serbia
-
 Singapore
-
 Slovakia
-
 Slovenia
-
 Somalia
-
 South Africa
-
 Spain
Spain
-
 Sri Lanka
-
 Sweden
-
 Switzerland
-
 Syria
Syria
-
 Taiwan
-
 Tajikistan
-
 Tanzania
-
 Thailand
-
 Trinidad and Tobago
-
 Tunisia
-
 Turkey
-
 UAE
UAE
-
 Uganda
-
 Ukraine
-
 United Kingdom
-
United States
-
 Uruguay
-
 Uzbekistan
-
 Venezuela
-
 Vietnam
-
 Yemen
Yemen
-
 Zambia
-
 Zimbabwe
- Forex
- Crypto
