
APT drops amid persistent bearish momentum confirmed by MACD ‘Strong Sell’ signal: weekly forecast

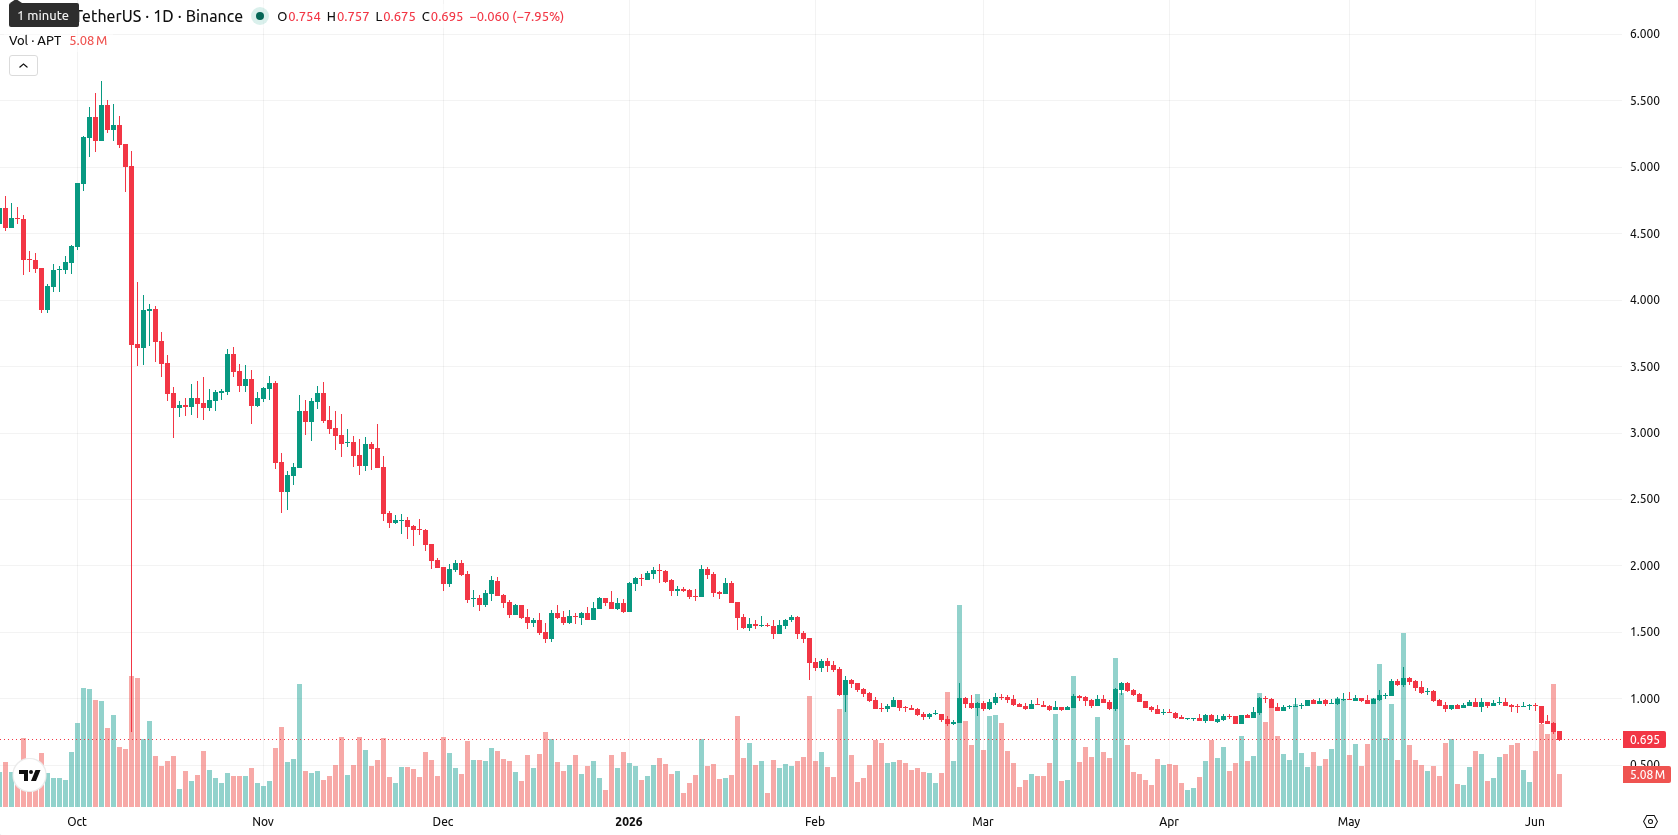
Aptos (APT) closed the week at $0.695, recording a sharp weekly decline of $0.24 or 25.67%. The token sits significantly below both the weekly MA-20 ($0.9738) and MA-50 ($2.5255), signaling persistent medium- and long-term downward pressure.
Highlights
- APT remains under persistent selling pressure, trading well below key moving averages and showing sustained bearish momentum.
- Technical indicators confirm a strong bearish trend, with oversold signals and sellers clearly dominant across major charts.
- Expected trading range for the next week is $0.60 to $0.83, with downside bias and low rebound probability.
Escalating bearish signals as technical weakness accelerates this week
On the weekly chart, all major technical indicators remain bearish for APT. Price action is deeply beneath the MA-20 and MA-50, with the Ichimoku Kijun at $1.3715 indicating distant resistance and the closest cap set by the MA-20. MACD sits firmly in 'Strong Sell' territory, ADX confirms the active bearish trend, and the RSI lingers in a weak zone at 31.56. Both the CCI and Stochastic RSI confirm oversold or neutral-to-bearish momentum, with negative Bull/Bear Power reinforcing seller dominance. Volatility soared this week at 33.20%, with price closing at the lower extreme of the recent range.
Sideways consolidation likely as volatility and resistance constrain recovery
Over the next 7 days, APT is most likely to consolidate sideways within the $0.60 to $0.83 range given the ongoing volatility and pronounced bearish signals. There is a low probability of a sustainable recovery, as no major indicators point to a reversal. Should buyers briefly regain control, the price could attempt to reclaim the $0.83 mark, but resistance levels remain formidable. If renewed selling pressure emerges, APT may test support at $0.67 or lower, possibly revisiting the $0.60 threshold.
Earlier, analysts noted that Aptos was entrenched in a persistent bearish trend with sellers firmly in control. This outlook is reinforced by the latest weekly data, and traders should remain alert to heightened volatility conditions, as sudden momentum shifts could lead to rapid tests of support or resistance levels within the current range.


Latest Aptos News


-
 Afghanistan
-
 Albania
-
 Algeria
-
 Angola
-
 Argentina
-
 Armenia
-
 Australia
-
 Austria
-
 Azerbaijan
-
 Bahamas
-
 Bahrain
-
 Bangladesh
-
 Belarus
-
 Belgium
-
 Bolivia
-
 Botswana
-
 Brazil
-
 Brunei
-
 Bulgaria
-
 Cambodia
-
 Cameroon
-
 Canada
-
 Chile
Chile
-
 China
China
-
 Colombia
-
 Congo
Congo
-
 Costa Rica
-
 Cote d'Ivoire
-
 Croatia
-
 Cuba
Cuba
-
 Cyprus
-
 Czechia
-
 DR Congo
-
 Denmark
-
 Dominican Republic
-
 Ecuador
-
 Egypt
Egypt
-
 El Salvador
-
 Estonia
-
 Eswatini
-
 Ethiopia
-
 Finland
-
 France
-
 Georgia
-
 Germany
-
 Ghana
Ghana
-
 Greece
-
 Haiti
Haiti
-
 Hong Kong
-
 Hungary
-
 India
India
-
 Indonesia
-
 Iran, Islamic republic
-
 Iraq
Iraq
-
 Ireland
-
 Israel
-
 Italy
Italy
-
 Jamaica
-
 Japan
Japan
-
 Jordan
-
 Kazakhstan
-
 Kenya
Kenya
-
 Korea
Korea
-
 Kuwait
-
 Kyrgyzstan
-
 Laos
Laos
-
 Latvia
-
 Lebanon
-
 Lesotho
-
 Libya
Libya
-
 Lithuania
-
 Luxembourg
-
 Madagascar
-
 Malaysia
-
 Malta
Malta
-
 Mauritius
-
 Mexico
-
 Moldova
-
 Mongolia
-
 Montenegro
-
 Morocco
-
 Mozambique
-
 Myanmar
-
 Namibia
-
 Nepal
Nepal
-
 Netherlands
-
 New Zealand
-
 Nigeria
-
 North Macedonia
-
 Norway
-
 Oman
Oman
-
 Pakistan
-
 Palestine
-
 Panama
-
 Papua New Guinea
-
 Paraguay
-
 Peru
Peru
-
 Philippines
-
 Poland
-
 Portugal
-
 Puerto Rico
-
 Qatar
Qatar
-
 Reunion
-
 Romania
-
 Rwanda
-
 Saudi Arabia
-
 Serbia
-
 Singapore
-
 Slovakia
-
 Slovenia
-
 Somalia
-
 South Africa
-
 Spain
Spain
-
 Sri Lanka
-
 Sweden
-
 Switzerland
-
 Syria
Syria
-
 Taiwan
-
 Tajikistan
-
 Tanzania
-
 Thailand
-
 Trinidad and Tobago
-
 Tunisia
-
 Turkey
-
 UAE
UAE
-
 Uganda
-
 Ukraine
-
 United Kingdom
-
United States
-
 Uruguay
-
 Uzbekistan
-
 Venezuela
-
 Vietnam
-
 Yemen
Yemen
-
 Zambia
-
 Zimbabwe
- Forex
- Crypto
