
Aptos price prediction: Will $0.5822 support hold? APT slides 7.08%

Aptos (APT) is trading at $0.6560, marking a daily decline of 7.08% and positioning the asset below its key moving averages. The price sits mid-range for the day amid elevated volatility.
 0.611
0.6330
0.611
0.6330
Highlights
- Aptos Foundation, with HashKey MENA and Daya, launched a regulated stablecoin corridor to streamline cross-border payments between the Middle East and Africa.
- The initiative integrates African fintechs and payment providers to boost real-world blockchain usage and enable B2B settlement on Aptos Layer 1.
- APT/USD remains under strong bearish pressure, trading below key technical levels with high downside probability and an expected 2–3 day range of $0.5822 to $0.7298.
Stablecoin corridor launch and ecosystem growth defy ongoing price pressure
On June 5, 2026, the Aptos Foundation, along with HashKey MENA and Daya, launched a pilot program establishing a regulated stablecoin payment corridor linking the Middle East and Africa, building compliant infrastructure for faster and lower-cost cross-border blockchain transactions (cointrust.com). This initiative was accompanied by integrations with African fintechs and payment providers, aiming to support higher real-world usage and was reported as enabling B2B settlement experiments on the Aptos Layer 1 blockchain (cryptowisser.com, afropolitain.com). Further context is provided by the Aptos ecosystem having reached over 200 projects with 2.95 billion transactions and notable growth in tokenized asset and stablecoin participation as of June 5, 2026 (tronweekly.com), though price action has remained under broader selling pressure.
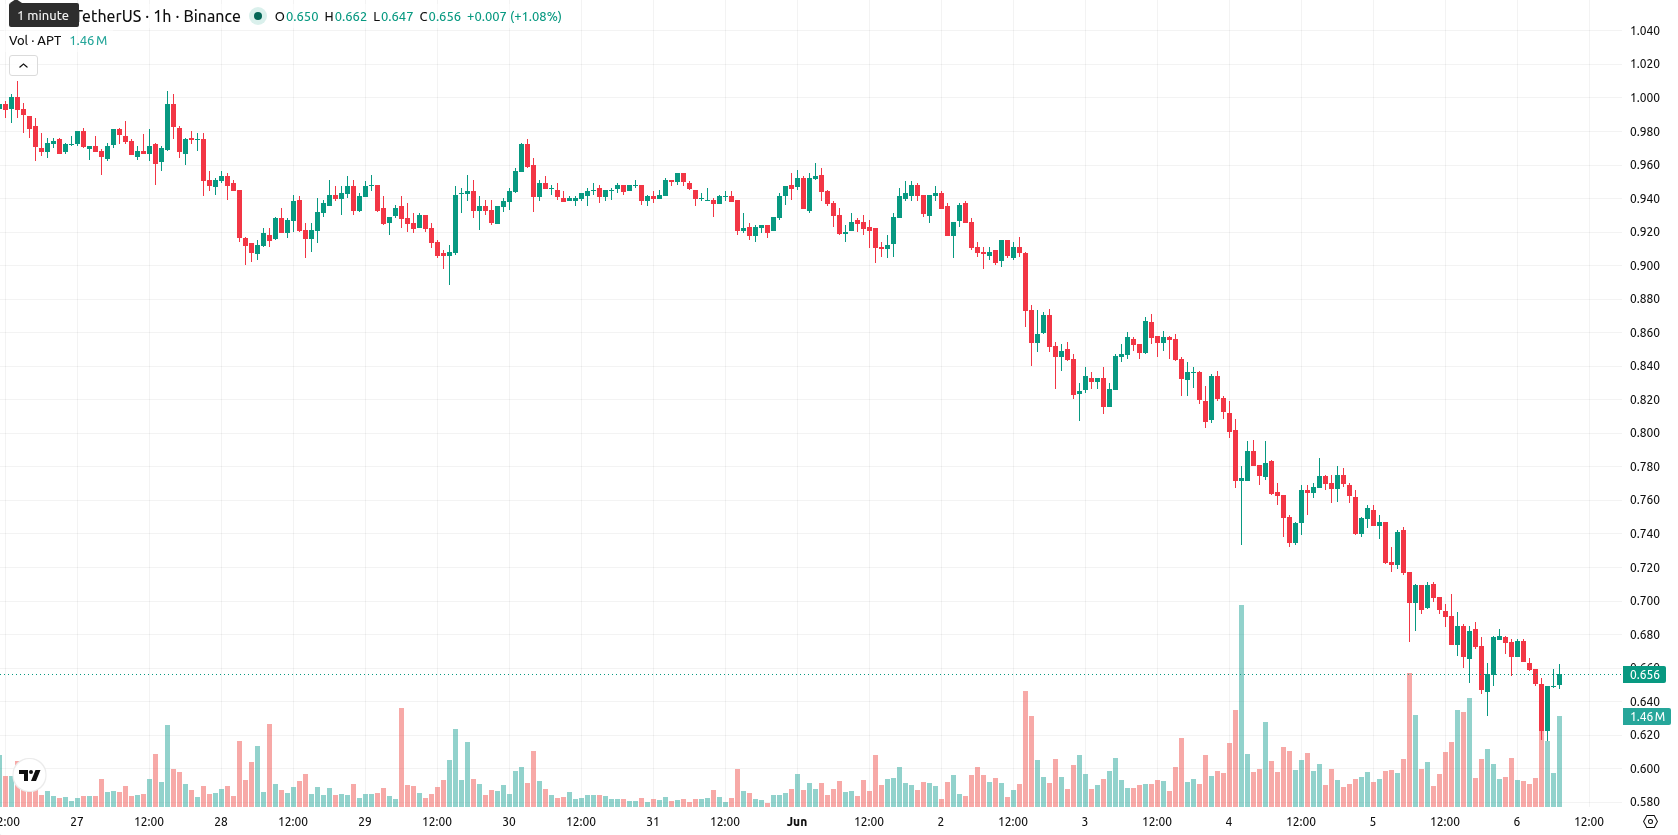
Sell signals cluster as APT trades below key technical thresholds
APT/USD is trading below its MA-20 at $0.6672 and MA-50 at $0.7146 on the H1 timeframe, and remains well under the MA-200 on the daily chart at $1.2854. The Ichimoku Kijun provides immediate resistance at $0.6805. MACD and ADX both signal strong sell momentum, while RSI at 41.7 and CCI are in negative territory. Notably, Stoch RSI is overbought, indicating divergence among oscillators, while BBP also confirms intraday seller dominance.
Downside risk dominates as rebound potential remains limited
Over the next 2–3 trading days, APT/USD is expected to fluctuate within a typical volatility band between $0.5822 and $0.7298. The probability of an upward reversal is considered very low, whereas the likelihood of continued downside is high. The most probable scenario sees the price remaining rangebound. An upward move above the Ichimoku Kijun resistance could prompt a short-term rebound, while a breakdown below the $0.5822 support would likely solidify the prevailing downtrend.
Earlier, analysts noted that Aptos was locked in a sustained bearish trend with momentum indicators signaling ongoing selling pressure. The current combination of continued price weakness and ecosystem developments suggests traders should closely watch for a decisive move below the recent support at $0.5822, which could further entrench the downtrend despite expanding real-world use cases.








-
 Afghanistan
-
 Albania
-
 Algeria
-
 Angola
-
 Argentina
-
 Armenia
-
 Australia
-
 Austria
-
 Azerbaijan
-
 Bahamas
-
 Bahrain
-
 Bangladesh
-
 Belarus
-
 Belgium
-
 Bolivia
-
 Botswana
-
 Brazil
-
 Brunei
-
 Bulgaria
-
 Cambodia
-
 Cameroon
-
 Canada
-
 Chile
Chile
-
 China
China
-
 Colombia
-
 Congo
Congo
-
 Costa Rica
-
 Cote d'Ivoire
-
 Croatia
-
 Cuba
Cuba
-
 Cyprus
-
 Czechia
-
 DR Congo
-
 Denmark
-
 Dominican Republic
-
 Ecuador
-
 Egypt
Egypt
-
 El Salvador
-
 Estonia
-
 Eswatini
-
 Ethiopia
-
 Finland
-
 France
-
 Georgia
-
 Germany
-
 Ghana
Ghana
-
 Greece
-
 Haiti
Haiti
-
 Hong Kong
-
 Hungary
-
 India
India
-
 Indonesia
-
 Iran, Islamic republic
-
 Iraq
Iraq
-
 Ireland
-
 Israel
-
 Italy
Italy
-
 Jamaica
-
 Japan
Japan
-
 Jordan
-
 Kazakhstan
-
 Kenya
Kenya
-
 Korea
Korea
-
 Kuwait
-
 Kyrgyzstan
-
 Laos
Laos
-
 Latvia
-
 Lebanon
-
 Lesotho
-
 Libya
Libya
-
 Lithuania
-
 Luxembourg
-
 Madagascar
-
 Malaysia
-
 Malta
Malta
-
 Mauritius
-
 Mexico
-
 Moldova
-
 Mongolia
-
 Montenegro
-
 Morocco
-
 Mozambique
-
 Myanmar
-
 Namibia
-
 Nepal
Nepal
-
 Netherlands
-
 New Zealand
-
 Nigeria
-
 North Macedonia
-
 Norway
-
 Oman
Oman
-
 Pakistan
-
 Palestine
-
 Panama
-
 Papua New Guinea
-
 Paraguay
-
 Peru
Peru
-
 Philippines
-
 Poland
-
 Portugal
-
 Puerto Rico
-
 Qatar
Qatar
-
 Reunion
-
 Romania
-
 Rwanda
-
 Saudi Arabia
-
 Serbia
-
 Singapore
-
 Slovakia
-
 Slovenia
-
 Somalia
-
 South Africa
-
 Spain
Spain
-
 Sri Lanka
-
 Sweden
-
 Switzerland
-
 Syria
Syria
-
 Taiwan
-
 Tajikistan
-
 Tanzania
-
 Thailand
-
 Trinidad and Tobago
-
 Tunisia
-
 Turkey
-
 UAE
UAE
-
 Uganda
-
 Ukraine
-
 United Kingdom
-
United States
-
 Uruguay
-
 Uzbekistan
-
 Venezuela
-
 Vietnam
-
 Yemen
Yemen
-
 Zambia
-
 Zimbabwe
- Forex
- Crypto











