
APT consolidates near recent lows amid persistent selling pressure below MA-20: weekly forecast

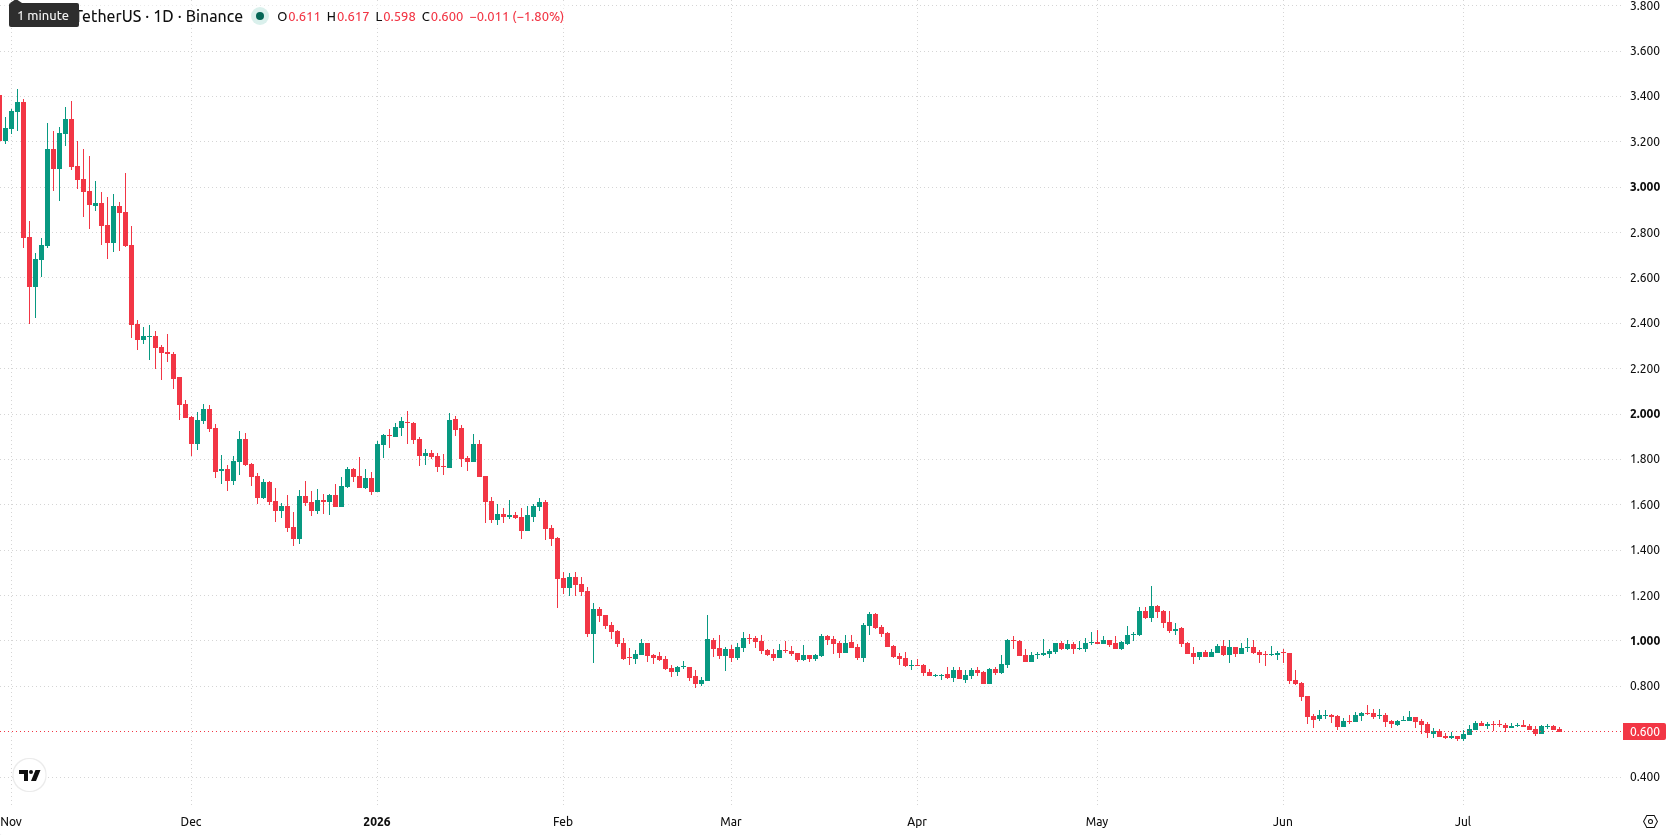
Aptos (APT) ended the week trading well below its weekly MA-20 at $0.8330 and MA-50 at $2.0231, confirming sustained bearish momentum and downward pressure. Over the last seven days, APT fell $0.0290 (4.60%) and remains near the lower end of its weekly range, firmly beneath its moving averages.
 0.611
0.6330
0.611
0.6330
Highlights
- APT remains in a firmly bearish trend, trading well below key moving averages and showing persistent selling pressure.
- Momentum indicators confirm downside dominance, with oversold signals across RSI, Stochastic, and CCI, but no clear reversal signs.
- APT is expected to trade between $0.578 and $0.624 this week, with a low probability of a meaningful upside move.
Technical signals reinforce downside bias as indicators stay negative
On the weekly chart, APT is entrenched below both the MA-20 and MA-50, highlighting ongoing selling strength with immediate dynamic resistance at the MA-20. The Ichimoku Kijun is far above the price and effectively out of play. Key technical indicators remain negative: MACD and ADX show a clear bearish trend, while RSI and Stochastic RSI hover in or near oversold territory. The CCI is also oversold, but does not yet signal a reversal. Bull/Bear Power remains negative, and the Awesome Oscillator is neutral, providing no added trend support. Weekly volatility stands at 12.11%, with APT tracking close to the week's lows and performance matching the persistent downside bias seen in technicals.
Sideways consolidation likely as upside scenarios lack confirmation
For the next 7 days, APT is expected to consolidate between $0.578 and $0.624. Based on the strongly bearish weekly signals and lack of bullish indicator confirmation, there is less than a 20% probability of a meaningful upward move. The baseline scenario is for continued sideways action within this range; should APT break above $0.624, resistance near the MA-20 could cap gains, while a drop below $0.578 may open the door to new yearly lows.
Earlier, analysts noted that persistent bearish momentum and weak technical signals continued to dominate Aptos price action. The latest data reinforce this negative outlook, with traders advised to monitor for a decisive break below $0.578 as the primary downside risk in the coming week.








-
 Afghanistan
-
 Albania
-
 Algeria
-
 Angola
-
 Argentina
-
 Armenia
-
 Australia
-
 Austria
-
 Azerbaijan
-
 Bahamas
-
 Bahrain
-
 Bangladesh
-
 Belarus
-
 Belgium
-
 Bolivia
-
 Botswana
-
 Brazil
-
 Brunei
-
 Bulgaria
-
 Cambodia
-
 Cameroon
-
 Canada
-
 Chile
Chile
-
 China
China
-
 Colombia
-
 Congo
Congo
-
 Costa Rica
-
 Cote d'Ivoire
-
 Croatia
-
 Cuba
Cuba
-
 Cyprus
-
 Czechia
-
 DR Congo
-
 Denmark
-
 Dominican Republic
-
 Ecuador
-
 Egypt
Egypt
-
 El Salvador
-
 Estonia
-
 Eswatini
-
 Ethiopia
-
 Finland
-
 France
-
 Georgia
-
 Germany
-
 Ghana
Ghana
-
 Greece
-
 Haiti
Haiti
-
 Hong Kong
-
 Hungary
-
 India
India
-
 Indonesia
-
 Iran, Islamic republic
-
 Iraq
Iraq
-
 Ireland
-
 Israel
-
 Italy
Italy
-
 Jamaica
-
 Japan
Japan
-
 Jordan
-
 Kazakhstan
-
 Kenya
Kenya
-
 Korea
Korea
-
 Kuwait
-
 Kyrgyzstan
-
 Laos
Laos
-
 Latvia
-
 Lebanon
-
 Lesotho
-
 Libya
Libya
-
 Lithuania
-
 Luxembourg
-
 Madagascar
-
 Malaysia
-
 Malta
Malta
-
 Mauritius
-
 Mexico
-
 Moldova
-
 Mongolia
-
 Montenegro
-
 Morocco
-
 Mozambique
-
 Myanmar
-
 Namibia
-
 Nepal
Nepal
-
 Netherlands
-
 New Zealand
-
 Nigeria
-
 North Macedonia
-
 Norway
-
 Oman
Oman
-
 Pakistan
-
 Palestine
-
 Panama
-
 Papua New Guinea
-
 Paraguay
-
 Peru
Peru
-
 Philippines
-
 Poland
-
 Portugal
-
 Puerto Rico
-
 Qatar
Qatar
-
 Reunion
-
 Romania
-
 Rwanda
-
 Saudi Arabia
-
 Serbia
-
 Singapore
-
 Slovakia
-
 Slovenia
-
 Somalia
-
 South Africa
-
 Spain
Spain
-
 Sri Lanka
-
 Sweden
-
 Switzerland
-
 Syria
Syria
-
 Taiwan
-
 Tajikistan
-
 Tanzania
-
 Thailand
-
 Trinidad and Tobago
-
 Tunisia
-
 Turkey
-
 UAE
UAE
-
 Uganda
-
 Ukraine
-
 United Kingdom
-
United States
-
 Uruguay
-
 Uzbekistan
-
 Venezuela
-
 Vietnam
-
 Yemen
Yemen
-
 Zambia
-
 Zimbabwe
- Forex
- Crypto











