
APT climbs toward range top with RSI hovering just above oversold: weekly review

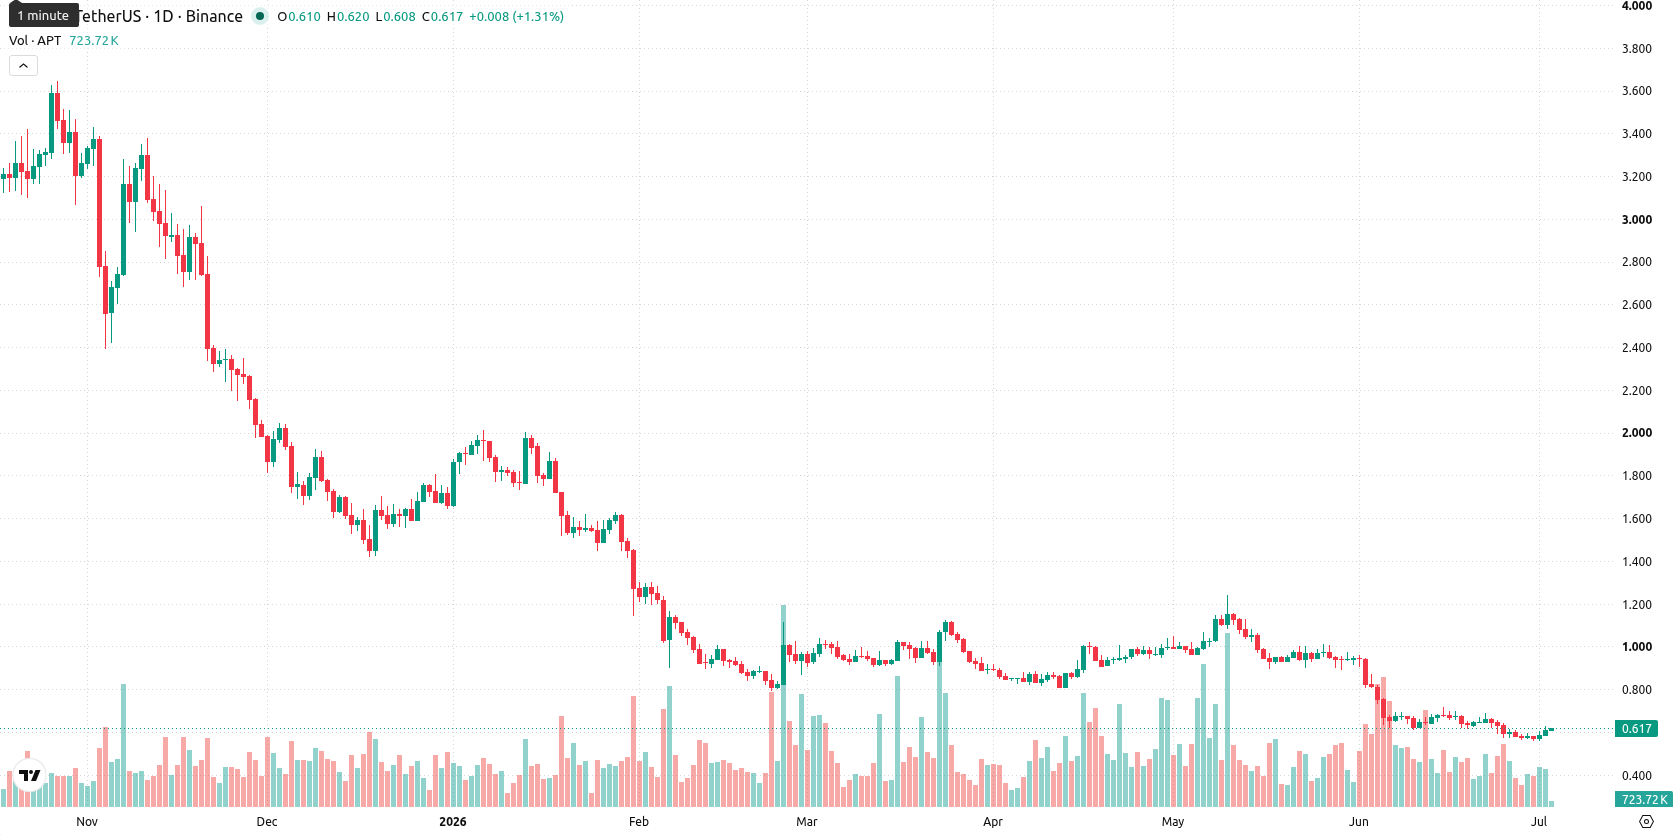
Aptos (APT) is trading at $0.617, clearly below both the weekly MA-20 ($0.8592) and MA-50 ($2.1808), signaling sustained medium- and long-term pressure from sellers. This week, the asset has climbed $0.018 (3.01%), closing near the top of its current weekly range and highlighting a short-term recovery, but it remains well beneath key technical thresholds.
Highlights
- APT remains under sustained selling pressure, trading below key moving averages and key resistance levels.
- Bearish momentum dominates as trend, momentum, and volatility indicators align with limited probability of upside movement.
- Expected range for the coming week is $0.555 to $0.680, with sideways consolidation most likely and risk of retesting lows if sellers persist.
Persistent weekly bearish momentum as downside signals accumulate
Weekly technical analysis confirms a dominant bearish trend, with APT positioned decisively below both its MA-20 and MA-50 levels. The Ichimoku Kijun sits high above at $1.2875, underscoring strong dynamic resistance. Both MACD and ADX display ongoing downside momentum. The RSI is just above oversold at 30.4, and the Commodity Channel Index also points to oversold conditions, while Bull/Bear Power and the Awesome Oscillator remain negative. Despite a minor Stochastic RSI hinting at potential rebound, sellers retain firm control from a weekly perspective.
Consolidation favored as downside risk outweighs rebound next week
Looking to the next 7 days, the adjusted forecast range sits between $0.555 and $0.680, reflecting recent price action and volatility of 12.79%. The probability of APT moving higher is very low — less than 20% — since none of the four key indicators show a Buy or Strong Buy signal, favoring the likelihood of a pullback. The baseline expectation is for price consolidation within this corridor. If a breakout above $0.680 does occur, further short-term upside is possible, but prevailing momentum suggests a more probable move toward $0.555 or lower if selling intensifies.
Earlier, analysts noted that Aptos was experiencing persistent bearish momentum and downside risk amid weak technical signals. This latest analysis confirms sustained seller control despite a short-term rebound, with heightened volatility reinforcing the importance of monitoring for potential breakdowns as APT remains locked below key moving averages.


-
 Afghanistan
-
 Albania
-
 Algeria
-
 Angola
-
 Argentina
-
 Armenia
-
 Australia
-
 Austria
-
 Azerbaijan
-
 Bahamas
-
 Bahrain
-
 Bangladesh
-
 Belarus
-
 Belgium
-
 Bolivia
-
 Botswana
-
 Brazil
-
 Brunei
-
 Bulgaria
-
 Cambodia
-
 Cameroon
-
 Canada
-
 Chile
Chile
-
 China
China
-
 Colombia
-
 Congo
Congo
-
 Costa Rica
-
 Cote d'Ivoire
-
 Croatia
-
 Cuba
Cuba
-
 Cyprus
-
 Czechia
-
 DR Congo
-
 Denmark
-
 Dominican Republic
-
 Ecuador
-
 Egypt
Egypt
-
 El Salvador
-
 Estonia
-
 Eswatini
-
 Ethiopia
-
 Finland
-
 France
-
 Georgia
-
 Germany
-
 Ghana
Ghana
-
 Greece
-
 Haiti
Haiti
-
 Hong Kong
-
 Hungary
-
 India
India
-
 Indonesia
-
 Iran, Islamic republic
-
 Iraq
Iraq
-
 Ireland
-
 Israel
-
 Italy
Italy
-
 Jamaica
-
 Japan
Japan
-
 Jordan
-
 Kazakhstan
-
 Kenya
Kenya
-
 Korea
Korea
-
 Kuwait
-
 Kyrgyzstan
-
 Laos
Laos
-
 Latvia
-
 Lebanon
-
 Lesotho
-
 Libya
Libya
-
 Lithuania
-
 Luxembourg
-
 Madagascar
-
 Malaysia
-
 Malta
Malta
-
 Mauritius
-
 Mexico
-
 Moldova
-
 Mongolia
-
 Montenegro
-
 Morocco
-
 Mozambique
-
 Myanmar
-
 Namibia
-
 Nepal
Nepal
-
 Netherlands
-
 New Zealand
-
 Nigeria
-
 North Macedonia
-
 Norway
-
 Oman
Oman
-
 Pakistan
-
 Palestine
-
 Panama
-
 Papua New Guinea
-
 Paraguay
-
 Peru
Peru
-
 Philippines
-
 Poland
-
 Portugal
-
 Puerto Rico
-
 Qatar
Qatar
-
 Reunion
-
 Romania
-
 Rwanda
-
 Saudi Arabia
-
 Serbia
-
 Singapore
-
 Slovakia
-
 Slovenia
-
 Somalia
-
 South Africa
-
 Spain
Spain
-
 Sri Lanka
-
 Sweden
-
 Switzerland
-
 Syria
Syria
-
 Taiwan
-
 Tajikistan
-
 Tanzania
-
 Thailand
-
 Trinidad and Tobago
-
 Tunisia
-
 Turkey
-
 UAE
UAE
-
 Uganda
-
 Ukraine
-
 United Kingdom
-
United States
-
 Uruguay
-
 Uzbekistan
-
 Venezuela
-
 Vietnam
-
 Yemen
Yemen
-
 Zambia
-
 Zimbabwe
- Forex
- Crypto
